ERP Jobs in the UK excluding London

Enterprise Resource Planning (ERP)
UK > UK excluding London

The table below provides summary statistics for permanent job vacancies advertised in the UK excluding London requiring ERP skills. It includes a benchmarking guide to the annual salaries offered in vacancies that cited ERP over the 6 months leading up to 17 May 2025, comparing them to the same period in the previous two years.

6 months to
17 May 2025
Same period 2024 Same period 2023
Rank 74 88 116
Rank change year-on-year +14 +28 +33
Permanent jobs citing ERP 1,378 2,093 1,763
As % of all permanent jobs advertised in the UK excluding London 3.47% 2.93% 2.97%
As % of the Processes & Methodologies category 3.74% 3.50% 3.11%
Number of salaries quoted 712 1,556 1,293
10th Percentile £31,250 £27,500 £32,500
25th Percentile £36,250 £37,500 £42,500
Median annual salary (50th Percentile) £51,250 £50,000 £55,000
Median % change year-on-year +2.50% -9.09% +10.00%
75th Percentile £61,250 £64,750 £65,000
90th Percentile £77,500 £80,000 £73,963
UK median annual salary £55,000 £54,000 £60,000
% change year-on-year +1.85% -10.00% +9.09%

All Process and Methodology Skills
UK excluding London

ERP falls under the Processes and Methodologies category. For comparison with the information above, the following table provides summary statistics for all permanent job vacancies requiring process or methodology skills in the UK excluding London.

Permanent vacancies with a requirement for process or methodology skills 36,887 59,718 56,668
As % of all permanent jobs advertised in the UK excluding London 92.92% 83.64% 95.62%
Number of salaries quoted 18,036 41,241 29,108
10th Percentile £26,902 £27,250 £30,500
25th Percentile £37,574 £36,250 £40,000
Median annual salary (50th Percentile) £51,810 £50,000 £55,000
Median % change year-on-year +3.62% -9.09% +4.76%
75th Percentile £65,000 £65,000 £70,000
90th Percentile £78,750 £77,500 £82,500
UK median annual salary £57,500 £55,000 £61,000
% change year-on-year +4.55% -9.84% +1.67%

ERP
Job Vacancy Trend in the UK excluding London

Job postings citing ERP as a proportion of all IT jobs advertised in the UK excluding London.
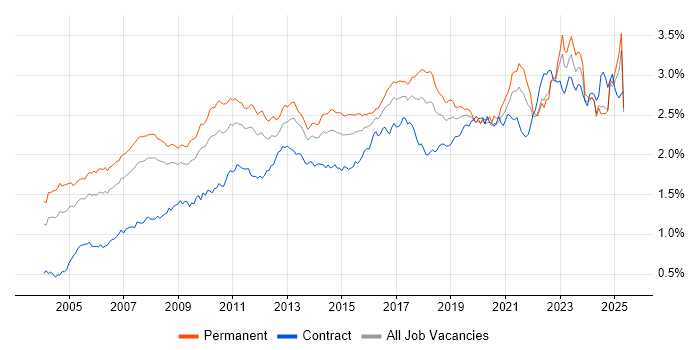
Job vacancy trend for ERP in the UK excluding London

ERP
Salary Trend in the UK excluding London

3-month moving average salary quoted in jobs citing ERP in the UK excluding London.

Salary trend for ERP in the UK excluding London

ERP
Salary Histogram in the UK excluding London

Salary distribution for jobs citing ERP in the UK excluding London over the 6 months to 17 May 2025.

Salary histogram for ERP in the UK excluding London

ERP
Job Locations in the UK excluding London

The table below looks at the demand and provides a guide to the median salaries quoted in IT jobs citing ERP within the UK excluding London region over the 6 months to 17 May 2025. The 'Rank Change' column provides an indication of the change in demand within each location based on the same 6 month period last year.

Location Rank Change
on Same Period
Last Year
Matching
Permanent
IT Job Ads
Median Salary
Past 6 Months
Median Salary
% Change
on Same Period
Last Year
Live
Jobs
South East +34 472 £55,000 +4.76% 293
North of England -35 428 £50,818 +1.64% 216
North West -17 370 £54,793 +9.59% 140
Midlands -34 204 £52,500 +10.53% 162
West Midlands -35 135 £52,500 +5.00% 67
East of England +2 130 £40,000 -27.27% 110
South West +86 115 £52,500 -3.67% 79
East Midlands -39 69 £45,000 +20.00% 87
Yorkshire -68 43 £45,000 -10.00% 61
Scotland +31 26 £62,500 +31.58% 41
North East +2 14 £35,000 -12.50% 18
Wales +27 9 £35,750 -20.56% 17
Northern Ireland +34 6 £50,000 -16.67% 11
ERP
UK

ERP
Co-occurring Skills and Capabilities in the UK excluding London by Category

The follow tables expand on the table above by listing co-occurrences grouped by category. The same employment type, locality and period is covered with up to 20 co-occurrences shown in each of the following categories:

Application Platforms
1 90 (6.53%) SharePoint
2 60 (4.35%) Confluence
3 20 (1.45%) CMS
4 14 (1.02%) OpenEdge
5 13 (0.94%) IBM Domino
6 5 (0.36%) Microsoft Exchange
7 4 (0.29%) Oracle Workflow
8 3 (0.22%) SugarCRM
Applications
1 99 (7.18%) Microsoft Office
2 98 (7.11%) Microsoft Excel
3 29 (2.10%) Microsoft PowerPoint
4 4 (0.29%) Microsoft Project
5 3 (0.22%) MS Visio
6 2 (0.15%) Oracle Smart View
6 2 (0.15%) Spreadsheet
7 1 (0.073%) AutoCAD
Business Applications
1 72 (5.22%) SAP S/4HANA
2 70 (5.08%) NetSuite
3 68 (4.93%) Dynamics AX
4 40 (2.90%) Oracle EBS
5 39 (2.83%) Dynamics NAV
6 32 (2.32%) SAP ERP
7 31 (2.25%) Oracle ERP
8 26 (1.89%) Shopify
9 18 (1.31%) Dynamics CRM
10 17 (1.23%) SAP FI
11 16 (1.16%) OpenText VIM for SAP
12 15 (1.09%) Sage 200
13 14 (1.02%) Magento
14 13 (0.94%) Infor CloudSuite Industrial (formerly SyteLine)
15 11 (0.80%) Infor CloudSuite
16 10 (0.73%) Infor M3
17 9 (0.65%) Oracle Applications
17 9 (0.65%) Sage CRM
18 8 (0.58%) Oracle Financials
18 8 (0.58%) Unit4 Business World
Cloud Services
1 110 (7.98%) Azure
2 106 (7.69%) Power Platform
3 92 (6.68%) Dynamics 365
4 62 (4.50%) Microsoft 365
5 54 (3.92%) SaaS
6 24 (1.74%) OCI
7 21 (1.52%) AWS
8 19 (1.38%) PaaS
9 17 (1.23%) iPaaS
10 14 (1.02%) BigCommerce
11 9 (0.65%) Cloud Computing
11 9 (0.65%) PowerApps
12 8 (0.58%) Boomi
12 8 (0.58%) Power Automate
13 6 (0.44%) Azure Data Factory
14 5 (0.36%) Collibra
14 5 (0.36%) GitHub
14 5 (0.36%) Microsoft Purview
14 5 (0.36%) Salesforce Commerce Cloud
14 5 (0.36%) SAP Commerce Cloud
Communications & Networking
1 32 (2.32%) Firewall
2 19 (1.38%) Network Security
2 19 (1.38%) VPN
3 17 (1.23%) SAN
4 15 (1.09%) VLAN
5 14 (1.02%) Wi-Fi
6 13 (0.94%) LAN
7 12 (0.87%) DHCP
7 12 (0.87%) WAN
8 11 (0.80%) VoIP
9 10 (0.73%) MPLS
10 8 (0.58%) TCP/IP
11 7 (0.51%) DNS
12 3 (0.22%) IPv4
13 2 (0.15%) IPsec
14 1 (0.073%) Internet
14 1 (0.073%) Wireless
Database & Business Intelligence
1 97 (7.04%) Power BI
2 53 (3.85%) SQL Server
3 25 (1.81%) Data Lake
4 24 (1.74%) Data Warehouse
4 24 (1.74%) SQL Server Reporting Services
5 22 (1.60%) Oracle ODI
6 15 (1.09%) Oracle Reports
7 12 (0.87%) Crystal Reports
8 11 (0.80%) SQL Server Integration Services
9 9 (0.65%) Oracle Database
10 8 (0.58%) Relational Database
10 8 (0.58%) Tableau
11 5 (0.36%) RDBMS
12 4 (0.29%) Azure SQL Data Warehouse
12 4 (0.29%) Big Data
12 4 (0.29%) DB2
12 4 (0.29%) MaxDB
12 4 (0.29%) Metadata
12 4 (0.29%) Metadata Repository
12 4 (0.29%) SAP HANA
Development Applications
1 64 (4.64%) JIRA
2 7 (0.51%) Oracle Forms
3 6 (0.44%) Git
3 6 (0.44%) Jenkins
4 4 (0.29%) Selenium
5 3 (0.22%) GitLab
6 2 (0.15%) IBM UrbanCode
6 2 (0.15%) JMeter
6 2 (0.15%) JUnit
6 2 (0.15%) LSMW
7 1 (0.073%) Cypress.io
7 1 (0.073%) Postman
7 1 (0.073%) RStudio
7 1 (0.073%) SonarQube
7 1 (0.073%) SQL Server Management Studio (SSMS)
7 1 (0.073%) Subversion
7 1 (0.073%) Team Foundation Server
7 1 (0.073%) TestNG
General
1 659 (47.82%) Finance
2 640 (46.44%) Social Skills
3 381 (27.65%) Manufacturing
4 207 (15.02%) Analytical Skills
5 95 (6.89%) Law
6 94 (6.82%) Organisational Skills
7 69 (5.01%) Retail
8 52 (3.77%) Marketing
9 46 (3.34%) Presentation Skills
10 41 (2.98%) Legal
11 31 (2.25%) Inclusion and Diversity
12 29 (2.10%) Telecoms
13 26 (1.89%) Games
14 20 (1.45%) General Ledger
15 17 (1.23%) Aerospace
16 13 (0.94%) Aviation
17 9 (0.65%) Back Office
17 9 (0.65%) Documentation Skills
17 9 (0.65%) Public Sector
18 7 (0.51%) Banking
Job Titles
1 237 (17.20%) Analyst
2 220 (15.97%) Systems Manager
3 213 (15.46%) Resource Manager
4 154 (11.18%) Architect
5 128 (9.29%) Lead
6 123 (8.93%) Solutions Architect
7 101 (7.33%) Consultant
8 93 (6.75%) Support Analyst
9 85 (6.17%) Applications Support
9 85 (6.17%) Senior
10 80 (5.81%) Developer
11 59 (4.28%) Lead Architect
12 58 (4.21%) Lead Solutions Architect
13 53 (3.85%) Project Manager
14 47 (3.41%) ERP Manager
15 45 (3.27%) Administrator
15 45 (3.27%) Financial Analyst
16 41 (2.98%) IT Support
17 40 (2.90%) ERP Analyst
17 40 (2.90%) IT Analyst
Libraries, Frameworks & Software Standards
1 44 (3.19%) Oracle Fusion
2 25 (1.81%) .NET
3 21 (1.52%) EDI
4 16 (1.16%) SAP Fiori
5 10 (0.73%) HTML
6 9 (0.65%) Web Services
7 6 (0.44%) CSS
7 6 (0.44%) SOAP
8 5 (0.36%) AngularJS
8 5 (0.36%) REST
8 5 (0.36%) RESTful
8 5 (0.36%) XML
9 4 (0.29%) React
9 4 (0.29%) SAP Basis
10 3 (0.22%) ASP.NET
10 3 (0.22%) Bootstrap
10 3 (0.22%) Tailwind CSS
11 2 (0.15%) Laravel
11 2 (0.15%) LDAP
11 2 (0.15%) Restlet
Miscellaneous
1 90 (6.53%) Management Information System
2 35 (2.54%) Self-Motivation
3 33 (2.39%) Legacy Systems
4 28 (2.03%) Data Structures
4 28 (2.03%) Product Ownership
5 22 (1.60%) Blockchain
5 22 (1.60%) Greenfield Project
5 22 (1.60%) Robotics
6 20 (1.45%) Analytical Mindset
7 17 (1.23%) Driving Licence
8 16 (1.16%) Virtual Team
9 15 (1.09%) EPoS
10 14 (1.02%) Onboarding
10 14 (1.02%) Video Conferencing
11 13 (0.94%) CCTV
12 12 (0.87%) Enterprise Software
12 12 (0.87%) FMCG
13 10 (0.73%) Hybrid Cloud
14 5 (0.36%) IoT
14 5 (0.36%) Social Media
Operating Systems
1 99 (7.18%) Windows
2 45 (3.27%) Linux
3 44 (3.19%) Windows Server
4 19 (1.38%) Windows 10
5 9 (0.65%) Apple iOS
6 6 (0.44%) Mac OS
6 6 (0.44%) Unix
7 4 (0.29%) AIX
8 3 (0.22%) Android
9 2 (0.15%) Oracle Linux
9 2 (0.15%) Windows Server 2012
9 2 (0.15%) Windows Server 2016
10 1 (0.073%) VMS
10 1 (0.073%) Windows Server 2019
Processes & Methodologies
1 372 (27.00%) Analytics
2 341 (24.75%) Continuous Improvement
3 310 (22.50%) Data Management
4 290 (21.04%) Problem-Solving
5 197 (14.30%) Agile
5 197 (14.30%) Project Management
6 163 (11.83%) CRM
7 158 (11.47%) Migration
8 155 (11.25%) Business Intelligence
9 134 (9.72%) Process Improvement
10 129 (9.36%) Stakeholder Management
11 119 (8.64%) PLM
11 119 (8.64%) Roadmaps
12 116 (8.42%) CAD
13 114 (8.27%) Data Migration
14 100 (7.26%) Decision-Making
15 95 (6.89%) Change Management
16 91 (6.60%) Mentoring
17 87 (6.31%) Business Strategy
18 84 (6.10%) Collaborative Working
Programming Languages
1 195 (14.15%) SQL
2 37 (2.69%) PL/SQL
3 29 (2.10%) Python
4 27 (1.96%) C#
5 25 (1.81%) JavaScript
6 21 (1.52%) ABAP
6 21 (1.52%) Java
7 19 (1.38%) Progress 4GL
8 18 (1.31%) T-SQL
9 17 (1.23%) PowerShell
10 9 (0.65%) VB.NET
11 7 (0.51%) Delphi
12 6 (0.44%) PHP
13 4 (0.29%) VBA
14 2 (0.15%) Groovy
14 2 (0.15%) VB
15 1 (0.073%) SAPscript
15 1 (0.073%) Shell Script
15 1 (0.073%) X++
15 1 (0.073%) XAML
Qualifications
1 210 (15.24%) BPSS Clearance
2 193 (14.01%) Degree
3 54 (3.92%) ACCA
4 49 (3.56%) CIMA
5 32 (2.32%) Security Cleared
6 26 (1.89%) Computer Science Degree
7 23 (1.67%) CISA
8 22 (1.60%) ISACA
9 16 (1.16%) CCAB
9 16 (1.16%) Master's Degree
9 16 (1.16%) SC Cleared
10 10 (0.73%) PMI Certification
10 10 (0.73%) PMP
11 9 (0.65%) HNC
12 8 (0.58%) ITIL Certification
13 6 (0.44%) Microsoft Certification
14 5 (0.36%) MBA
14 5 (0.36%) Oracle Certification
15 4 (0.29%) MCSA
15 4 (0.29%) MCSE
Quality Assurance & Compliance
1 76 (5.52%) Data Quality
2 28 (2.03%) SLA
3 25 (1.81%) QA
4 22 (1.60%) ITGC
5 15 (1.09%) GDPR
6 8 (0.58%) Cyber Essentials
7 6 (0.44%) GxP
8 4 (0.29%) Accessibility
8 4 (0.29%) COBIT
8 4 (0.29%) GRC
8 4 (0.29%) PMO
9 3 (0.22%) ISO/IEC 27001
9 3 (0.22%) PCI DSS
10 2 (0.15%) Cyber Essentials PLUS
10 2 (0.15%) NIST
10 2 (0.15%) SOC 2
System Software
1 49 (3.56%) Active Directory
2 22 (1.60%) VMware Infrastructure
3 15 (1.09%) VMware ESXi
4 5 (0.36%) Docker
5 2 (0.15%) Hyper-V
6 1 (0.073%) Virtual Servers
Systems Management
1 6 (0.44%) Microsoft Intune
2 3 (0.22%) Kubernetes
3 2 (0.15%) Ansible
3 2 (0.15%) Single Sign-On
3 2 (0.15%) Terraform
4 1 (0.073%) Systems Management Server (SMS)
Vendors
1 373 (27.07%) SAP
2 323 (23.44%) Microsoft
3 149 (10.81%) Oracle
4 58 (4.21%) Siemens
5 37 (2.69%) Salesforce
6 35 (2.54%) VMware
7 34 (2.47%) Sage
8 26 (1.89%) Infor
9 23 (1.67%) Veeam
10 19 (1.38%) Progress
11 18 (1.31%) Epicor
12 17 (1.23%) IFS
13 14 (1.02%) Workday
14 13 (0.94%) JD Edwards
15 10 (0.73%) IBM
16 9 (0.65%) Informatica
16 9 (0.65%) PeopleSoft
17 7 (0.51%) Red Hat
18 6 (0.44%) Apple
18 6 (0.44%) Dell