Infrastructure Engineer Jobs in the UK excluding London

Infrastructure Engineer
UK > UK excluding London

The median Infrastructure Engineer salary in the UK excluding London is £50,000 per year, according to job vacancies posted during the 6 months leading to 31 May 2025.

The table below provides salary benchmarking and summary statistics, comparing them to the same period in the previous two years.

6 months to
31 May 2025
Same period 2024 Same period 2023
Rank 183 92 210
Rank change year-on-year -91 +118 0
Permanent jobs requiring an Infrastructure Engineer 677 2,071 997
As % of all permanent jobs advertised in the UK excluding London 1.71% 2.77% 1.74%
As % of the Job Titles category 1.89% 2.91% 1.95%
Number of salaries quoted 317 1,702 751
10th Percentile £35,000 £35,000 £34,988
25th Percentile £39,000 £40,000 £39,875
Median annual salary (50th Percentile) £50,000 £47,500 £47,000
Median % change year-on-year +5.26% +1.06% +4.44%
75th Percentile £60,000 £57,500 £55,000
90th Percentile £70,000 £65,000 £63,750
UK median annual salary £55,000 £49,000 £50,000
% change year-on-year +12.24% -2.00% -

All Permanent IT Job Vacancies
UK excluding London

For comparison with the information above, the following table provides summary statistics for all permanent IT job vacancies in the UK excluding London. Most job vacancies include a discernible job title that can be normalized. As such, the figures in the second row provide an indication of the number of permanent jobs in our overall sample.

Permanent vacancies in the UK excluding London with a recognized job title 35,806 71,101 51,023
% of permanent jobs with a recognized job title 90.22% 94.94% 89.01%
Number of salaries quoted 18,138 50,103 29,550
10th Percentile £26,250 £26,750 £29,750
25th Percentile £36,750 £35,000 £38,750
Median annual salary (50th Percentile) £51,000 £50,000 £53,500
Median % change year-on-year +2.00% -6.54% +6.49%
75th Percentile £65,000 £63,750 £68,750
90th Percentile £77,500 £76,250 £81,250
UK median annual salary £55,000 £52,500 £60,000
% change year-on-year +4.76% -12.50% -

Infrastructure Engineer
Job Vacancy Trend in the UK excluding London

Job postings that featured Infrastructure Engineer in the job title as a proportion of all IT jobs advertised in the UK excluding London.
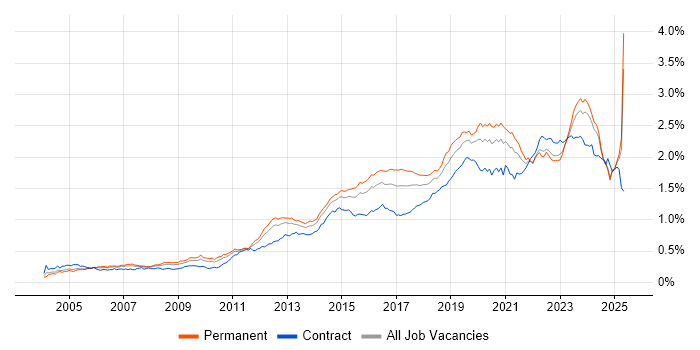
Job vacancy trend for Infrastructure Engineer in the UK excluding London

Infrastructure Engineer
Salary Trend in the UK excluding London

3-month moving average salary quoted in jobs citing Infrastructure Engineer in the UK excluding London.

Salary trend for Infrastructure Engineer in the UK excluding London

Infrastructure Engineer
Salary Histogram in the UK excluding London

Salary distribution for jobs citing Infrastructure Engineer in the UK excluding London over the 6 months to 31 May 2025.

Salary histogram for Infrastructure Engineer in the UK excluding London

Infrastructure Engineer
Job Locations in the UK excluding London

The table below looks at the demand and provides a guide to the median salaries quoted in IT jobs citing Infrastructure Engineer within the UK excluding London region over the 6 months to 31 May 2025. The 'Rank Change' column provides an indication of the change in demand within each location based on the same 6 month period last year.

Location Rank Change
on Same Period
Last Year
Matching
Permanent
IT Job Ads
Median Salary
Past 6 Months
Median Salary
% Change
on Same Period
Last Year
Live
Jobs
North of England -22 372 £52,000 +15.56% 114
North West +7 328 £51,000 +13.33% 75
South East -124 108 £46,250 -7.50% 66
Midlands -89 87 £41,500 -7.78% 68
West Midlands -29 61 £40,500 -10.00% 36
East of England -53 52 £55,320 +22.93% 41
Yorkshire -44 34 £60,000 +41.18% 21
South West -97 29 £51,729 +3.46% 68
East Midlands -73 26 £46,000 +2.22% 32
Scotland +72 19 £50,000 +5.26% 17
North East -15 10 £52,000 +17.45% 19
Wales +9 9 £42,903 +4.47% 11
Northern Ireland +36 2 £53,750 -10.42% 8
Infrastructure Engineer
UK

Infrastructure Engineer Skill Set
Top 30 Co-occurring Skills and Capabilities in the UK excluding London

For the 6 months to 31 May 2025, Infrastructure Engineer job roles required the following skills and capabilities in order of popularity. The figures indicate the absolute number co-occurrences and as a proportion of all permanent job ads across the UK excluding London region featuring Infrastructure Engineer in the job title.

1 670 (98.97%) Infrastructure Engineering
2 471 (69.57%) Windows
3 377 (55.69%) PowerShell
4 352 (51.99%) Linux
5 334 (49.34%) Problem-Solving
6 319 (47.12%) Terraform
7 311 (45.94%) DevOps
7 311 (45.94%) Ansible
8 310 (45.79%) Hyper-V
8 310 (45.79%) Python
9 308 (45.49%) Cisco
10 303 (44.76%) Inclusion and Diversity
11 296 (43.72%) VPN
12 287 (42.39%) vSphere
13 282 (41.65%) Bash
14 280 (41.36%) Docker
15 274 (40.47%) Analytical Skills
16 272 (40.18%) Juniper
16 272 (40.18%) Task Automation
17 271 (40.03%) VMware NSX
18 270 (39.88%) Risk Management
19 269 (39.73%) Line Management
20 266 (39.29%) Storage Management
21 265 (39.14%) Splunk
22 264 (39.00%) Platform Engineering
23 263 (38.85%) Android
23 263 (38.85%) Elastic Stack
24 262 (38.70%) Cisco IOS
25 260 (38.40%) Mathematics
25 260 (38.40%) Cyberattack

Infrastructure Engineer Skill Set
Co-occurring Skills and Capabilities in the UK excluding London by Category

The follow tables expand on the table above by listing co-occurrences grouped by category. The same employment type, locality and period is covered with up to 20 co-occurrences shown in each of the following categories:

Application Platforms
1 99 (14.62%) Microsoft Exchange
2 21 (3.10%) SharePoint
3 15 (2.22%) IIS
4 9 (1.33%) Confluence
5 6 (0.89%) Apache
6 4 (0.59%) Skype for Business
7 3 (0.44%) Exchange Server 2010
8 2 (0.30%) CICS
9 1 (0.15%) Apache Airflow
9 1 (0.15%) nginx
9 1 (0.15%) Tomcat
9 1 (0.15%) WebSphere
Applications
1 21 (3.10%) AutoCAD
2 12 (1.77%) Microsoft Office
3 2 (0.30%) Mozilla Thunderbird
Business Applications
1 2 (0.30%) Dynamics AX
2 1 (0.15%) Dynamics GP
Cloud Services
1 155 (22.90%) Azure
2 95 (14.03%) Microsoft 365
3 59 (8.71%) AWS
4 40 (5.91%) Entra ID
5 22 (3.25%) GCP
6 17 (2.51%) Amazon EC2
7 14 (2.07%) Power Platform
7 14 (2.07%) SaaS
8 13 (1.92%) IaaS
8 13 (1.92%) PowerApps
8 13 (1.92%) Virtual Private Cloud
9 12 (1.77%) Azure Logic Apps
10 11 (1.62%) Azure DevOps
10 11 (1.62%) Microsoft Purview
10 11 (1.62%) Nutanix
11 10 (1.48%) Amazon S3
11 10 (1.48%) AWS KMS
12 8 (1.18%) Amazon ELB
12 8 (1.18%) Amazon Glacier
12 8 (1.18%) PaaS
Communications & Networking
1 296 (43.72%) VPN
2 262 (38.70%) Cisco IOS
3 106 (15.66%) Firewall
4 76 (11.23%) DNS
5 67 (9.90%) DHCP
6 57 (8.42%) WAN
7 48 (7.09%) LAN
8 47 (6.94%) SAN
9 33 (4.87%) NAS
10 30 (4.43%) SD-WAN
11 24 (3.55%) Wi-Fi
12 22 (3.25%) Network Security
12 22 (3.25%) TCP/IP
13 19 (2.81%) SMTP
13 19 (2.81%) VLAN
14 11 (1.62%) 5G
14 11 (1.62%) Bluetooth
14 11 (1.62%) LTE
15 8 (1.18%) Remote Desktop
15 8 (1.18%) SNMP
Database & Business Intelligence
1 36 (5.32%) SQL Server
2 16 (2.36%) Amazon RDS
3 7 (1.03%) MongoDB
4 6 (0.89%) PostgreSQL
5 3 (0.44%) Azure SQL Database
5 3 (0.44%) Power BI
5 3 (0.44%) SQL Server Reporting Services
6 2 (0.30%) Crystal Reports
6 2 (0.30%) DB2
6 2 (0.30%) MySQL
7 1 (0.15%) Azure SQL Data Warehouse
7 1 (0.15%) Big Data
7 1 (0.15%) Data Warehouse
7 1 (0.15%) NoSQL
7 1 (0.15%) RDBMS
7 1 (0.15%) Relational Database
7 1 (0.15%) SQL Server Analysis Services
7 1 (0.15%) SQL Server Integration Services
Development Applications
1 15 (2.22%) JIRA
2 13 (1.92%) Jenkins
3 9 (1.33%) Git
4 8 (1.18%) Vagrant
5 5 (0.74%) Oracle Forms
6 4 (0.59%) Sonatype Nexus
7 2 (0.30%) Bitbucket Server
8 1 (0.15%) Atlassian Bamboo
8 1 (0.15%) Bitbucket
8 1 (0.15%) GitLab
8 1 (0.15%) Selenium
8 1 (0.15%) SQL Server Management Studio (SSMS)
General
1 303 (44.76%) Inclusion and Diversity
2 274 (40.47%) Analytical Skills
3 104 (15.36%) Social Skills
4 45 (6.65%) Finance
5 39 (5.76%) Public Sector
6 20 (2.95%) Local Government
7 14 (2.07%) Legal
8 12 (1.77%) Electronics
8 12 (1.77%) Manufacturing
8 12 (1.77%) Retail
9 9 (1.33%) Banking
9 9 (1.33%) Telecoms
10 8 (1.18%) Law
10 8 (1.18%) Presentation Skills
11 7 (1.03%) Games
12 4 (0.59%) Advertising
12 4 (0.59%) Documentation Skills
13 3 (0.44%) Automotive
14 2 (0.30%) Marketing
14 2 (0.30%) Organisational Skills
Libraries, Frameworks & Software Standards
1 263 (38.85%) Elastic Stack
2 10 (1.48%) OLE
3 8 (1.18%) ARM Templates
4 7 (1.03%) Middleware
5 4 (0.59%) Web Services
5 4 (0.59%) YAML
6 3 (0.44%) SAML
7 2 (0.30%) .NET
7 2 (0.30%) JSON
7 2 (0.30%) Node.js
8 1 (0.15%) .NET Framework
8 1 (0.15%) 802.1X
8 1 (0.15%) OpenCL
8 1 (0.15%) REST
Miscellaneous
1 260 (38.40%) Cyberattack
2 37 (5.47%) Data Centre
3 28 (4.14%) Clustering
4 14 (2.07%) NHS
4 14 (2.07%) PKI
5 12 (1.77%) Hybrid Cloud
6 11 (1.62%) IoT
6 11 (1.62%) NB-IoT
7 10 (1.48%) Driving Licence
8 9 (1.33%) Replication
9 8 (1.18%) Legacy Systems
9 8 (1.18%) Private Cloud
10 6 (0.89%) Enterprise Storage
10 6 (0.89%) Product Ownership
10 6 (0.89%) Self-Motivation
11 5 (0.74%) Blackberry
11 5 (0.74%) Cloud Native
11 5 (0.74%) Management Information System
12 4 (0.59%) Public Cloud
12 4 (0.59%) Video Conferencing
Operating Systems
1 471 (69.57%) Windows
2 352 (51.99%) Linux
3 263 (38.85%) Android
4 135 (19.94%) Windows Server
5 20 (2.95%) Windows Server 2016
6 16 (2.36%) Windows 10
7 14 (2.07%) VMS
7 14 (2.07%) Windows Server 2019
8 13 (1.92%) Unix
9 10 (1.48%) Ubuntu
10 9 (1.33%) Windows Server 2012
11 8 (1.18%) CentOS
12 6 (0.89%) Red Hat Enterprise Linux
13 5 (0.74%) Debian
14 4 (0.59%) Apple iOS
14 4 (0.59%) Windows Server 2003
15 3 (0.44%) AIX
15 3 (0.44%) Mac OS
15 3 (0.44%) Windows Server 2008
16 2 (0.30%) SUSE
Processes & Methodologies
1 670 (98.97%) Infrastructure Engineering
2 334 (49.34%) Problem-Solving
3 311 (45.94%) DevOps
4 272 (40.18%) Task Automation
5 270 (39.88%) Risk Management
6 269 (39.73%) Line Management
7 266 (39.29%) Storage Management
8 264 (39.00%) Platform Engineering
9 260 (38.40%) Mathematics
10 54 (7.98%) Disaster Recovery
10 54 (7.98%) Mentoring
11 51 (7.53%) ITIL
12 45 (6.65%) Continuous Improvement
13 43 (6.35%) High Availability
14 36 (5.32%) Infrastructure as Code
15 33 (4.87%) Cloud Security
16 30 (4.43%) Customer Service
17 29 (4.28%) Project Delivery
18 28 (4.14%) Agile
19 27 (3.99%) Migration
Programming Languages
1 377 (55.69%) PowerShell
2 310 (45.79%) Python
3 282 (41.65%) Bash
4 29 (4.28%) SQL
5 7 (1.03%) Groovy
6 5 (0.74%) Java
7 3 (0.44%) Bicep
7 3 (0.44%) Perl
8 2 (0.30%) Shell Script
9 1 (0.15%) JavaScript
9 1 (0.15%) JCL
9 1 (0.15%) T-SQL
Qualifications
1 79 (11.67%) Degree
2 74 (10.93%) Security Cleared
3 49 (7.24%) Microsoft Certification
4 44 (6.50%) DV Cleared
5 37 (5.47%) SC Cleared
6 31 (4.58%) Azure Certification
7 20 (2.95%) MCSA
8 16 (2.36%) A+ Certification
8 16 (2.36%) MCP
9 15 (2.22%) CompTIA Security+
9 15 (2.22%) Network+ Certification
10 14 (2.07%) MCSE
11 13 (1.92%) HND
12 11 (1.62%) VMware Certified Professional (VCP)
13 10 (1.48%) AWS Certification
14 7 (1.03%) Cisco Certification
14 7 (1.03%) RIBA
15 6 (0.89%) CCNA
15 6 (0.89%) Postgraduate
16 5 (0.74%) Computer Science Degree
Quality Assurance & Compliance
1 12 (1.77%) Accessibility
2 10 (1.48%) ISO/IEC 27001
3 9 (1.33%) GDPR
4 8 (1.18%) Cyber Essentials
4 8 (1.18%) QA
5 5 (0.74%) Cyber Essentials PLUS
5 5 (0.74%) NIST
6 3 (0.44%) SLA
7 2 (0.30%) HIPAA
8 1 (0.15%) Government Security Classifications
8 1 (0.15%) GRC
8 1 (0.15%) PCI DSS
System Software
1 310 (45.79%) Hyper-V
2 287 (42.39%) vSphere
3 280 (41.36%) Docker
4 271 (40.03%) VMware NSX
5 161 (23.78%) Active Directory
6 100 (14.77%) VMware Infrastructure
7 21 (3.10%) VMware ESXi
8 18 (2.66%) Virtual Machines
9 14 (2.07%) Virtual Desktop
10 9 (1.33%) BitLocker
11 8 (1.18%) Microsoft App-V
11 8 (1.18%) Terminal Services
12 7 (1.03%) DFS Replication
13 4 (0.59%) Virtual Servers
14 2 (0.30%) Dovecot
14 2 (0.30%) Postfix
14 2 (0.30%) XenApp
15 1 (0.15%) KVM
15 1 (0.15%) RACF
15 1 (0.15%) XenDesktop
Systems Management
1 319 (47.12%) Terraform
2 311 (45.94%) Ansible
3 33 (4.87%) Microsoft Intune
4 27 (3.99%) Kubernetes
5 22 (3.25%) Puppet
6 16 (2.36%) SCCM
7 14 (2.07%) vCenter Server
8 10 (1.48%) Grafana
9 9 (1.33%) Progress Chef
9 9 (1.33%) Prometheus
9 9 (1.33%) WSUS
10 8 (1.18%) SCOM
10 8 (1.18%) vMotion
11 7 (1.03%) FortiGate
12 6 (0.89%) Active Directory Federation Services
12 6 (0.89%) Nagios
13 4 (0.59%) Nessus
13 4 (0.59%) Proxmox
14 3 (0.44%) Backup Exec
14 3 (0.44%) Failover Clustering
Vendors
1 308 (45.49%) Cisco
2 272 (40.18%) Juniper
3 265 (39.14%) Splunk
4 260 (38.40%) 3PAR
5 205 (30.28%) Microsoft
6 143 (21.12%) VMware
7 29 (4.28%) Citrix
8 23 (3.40%) Veeam
9 15 (2.22%) Google
10 14 (2.07%) ServiceNow
11 13 (1.92%) Dell
11 13 (1.92%) HP
12 11 (1.62%) Meraki
13 8 (1.18%) Autodesk
13 8 (1.18%) Oracle
13 8 (1.18%) Red Hat
14 6 (0.89%) Fortinet
14 6 (0.89%) McAfee
14 6 (0.89%) Sophos
14 6 (0.89%) Symantec