Line Management Jobs in the UK excluding London

Line Management
UK > UK excluding London

The following table provides summary statistics for permanent job vacancies advertised in the UK excluding London with a requirement for Line Management skills. Included is a benchmarking guide to the salaries offered in vacancies that have cited Line Management over the 6 months to 3 May 2024 with a comparison to the same period in the previous 2 years.

6 months to
3 May 2024
Same period 2023 Same period 2022
Rank 133 94 133
Rank change year-on-year -39 +39 +34
Permanent jobs citing Line Management 1,529 2,168 1,895
As % of all permanent jobs advertised in the UK excluding London 2.17% 3.53% 2.67%
As % of the Processes & Methodologies category 2.57% 3.69% 2.84%
Number of salaries quoted 1,043 857 1,053
10th Percentile £26,500 £33,750 £31,250
25th Percentile £36,250 £44,000 £41,250
Median annual salary (50th Percentile) £48,500 £60,000 £53,112
Median % change year-on-year -19.17% +12.97% +6.22%
75th Percentile £63,750 £78,750 £70,000
90th Percentile £75,772 £92,500 £81,386
UK median annual salary £52,396 £65,351 £60,000
% change year-on-year -19.82% +8.92% +4.35%

All Process and Methodology Skills
UK excluding London

Line Management is in the Processes and Methodologies category. The following table is for comparison with the above and provides summary statistics for all permanent job vacancies advertised in the UK excluding London with a requirement for process or methodology skills.

Permanent vacancies with a requirement for process or methodology skills 59,415 58,778 66,796
As % of all permanent jobs advertised in the UK excluding London 84.38% 95.62% 94.04%
Number of salaries quoted 41,129 30,196 41,543
10th Percentile £27,117 £30,500 £30,000
25th Percentile £36,250 £40,000 £38,750
Median annual salary (50th Percentile) £50,000 £55,000 £52,500
Median % change year-on-year -9.09% +4.76% +9.38%
75th Percentile £65,000 £70,000 £67,500
90th Percentile £77,500 £82,500 £80,000
UK median annual salary £55,000 £61,500 £60,000
% change year-on-year -10.57% +2.50% +9.09%

Line Management
Job Vacancy Trend in the UK excluding London

Job postings citing Line Management as a proportion of all IT jobs advertised in the UK excluding London.
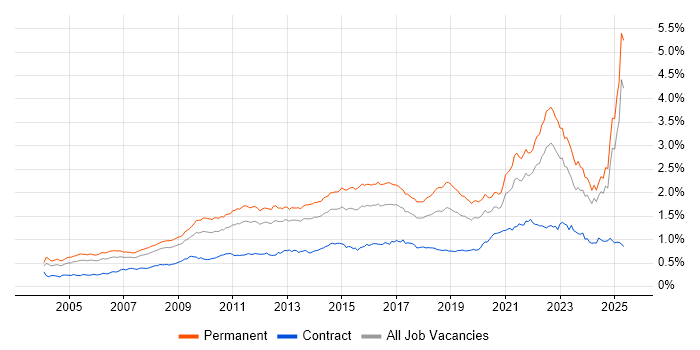
Job vacancy trend for Line Management in the UK excluding London

Line Management
Salary Trend in the UK excluding London

3-month moving average salary quoted in jobs citing Line Management in the UK excluding London.

Salary trend for Line Management in the UK excluding London

Line Management
Salary Histogram in the UK excluding London

Salary distribution for jobs citing Line Management in the UK excluding London over the 6 months to 3 May 2024.

Salary histogram for Line Management in the UK excluding London

Line Management
Job Locations in the UK excluding London

The table below looks at the demand and provides a guide to the median salaries quoted in IT jobs citing Line Management within the UK excluding London region over the 6 months to 3 May 2024. The 'Rank Change' column provides an indication of the change in demand within each location based on the same 6 month period last year.

Location Rank Change
on Same Period
Last Year
Matching
Permanent
IT Job Ads
Median Salary
Past 6 Months
Median Salary
% Change
on Same Period
Last Year
Live
Jobs
North of England +13 399 £52,500 -7.89% 193
South East -63 300 £47,500 -32.14% 158
South West -38 246 £49,029 -9.58% 108
Midlands -62 224 £44,094 -22.41% 127
North West +27 204 £55,000 - 104
East of England +28 191 £42,750 +12.50% 95
West Midlands -71 159 £46,500 -13.89% 83
Yorkshire +11 140 £52,500 -12.50% 69
Scotland -99 115 £50,000 -34.54% 34
East Midlands -2 65 £40,000 -37.25% 44
North East +25 55 £44,094 -17.58% 22
Wales +42 54 £42,500 -11.46% 35
Northern Ireland +24 5 £58,800 +17.60% 4
Line Management
UK

Line Management
Co-occurring Skills and Capabilities in the UK excluding London by Category

The follow tables expand on the table above by listing co-occurrences grouped by category. The same employment type, locality and period is covered with up to 20 co-occurrences shown in each of the following categories:

Application Platforms
1 91 (5.95%) SharePoint
2 55 (3.60%) Microsoft Exchange
3 16 (1.05%) IIS
4 9 (0.59%) CMS
5 7 (0.46%) Apache Spark
5 7 (0.46%) Confluence
5 7 (0.46%) MS Project Server
5 7 (0.46%) WordPress
6 5 (0.33%) Office Communications Server
7 3 (0.20%) ArcGIS
8 2 (0.13%) Umbraco
9 1 (0.065%) Apache
9 1 (0.065%) Drupal
9 1 (0.065%) JOnAS
9 1 (0.065%) Moodle
9 1 (0.065%) OpenStack
9 1 (0.065%) SAS
9 1 (0.065%) Skype for Business
9 1 (0.065%) Tomcat
9 1 (0.065%) Totara
Applications
1 112 (7.33%) Microsoft Excel
2 74 (4.84%) Microsoft Office
3 46 (3.01%) Microsoft PowerPoint
4 12 (0.78%) Microsoft Project
5 4 (0.26%) Simulink
6 3 (0.20%) SPSS
7 2 (0.13%) FileZilla
7 2 (0.13%) MadCap Flare
8 1 (0.065%) MS Visio
8 1 (0.065%) Photoshop
8 1 (0.065%) Spreadsheet
Business Applications
1 10 (0.65%) Oracle EBS
2 9 (0.59%) Dynamics CRM
3 6 (0.39%) Oracle Applications
4 4 (0.26%) Dynamics GP
4 4 (0.26%) Dynamics NAV
4 4 (0.26%) NEC Housing
5 3 (0.20%) SAP CO
5 3 (0.20%) SAP FI
5 3 (0.20%) SAP FI/CO
6 2 (0.13%) Salesforce CRM
6 2 (0.13%) SAP S/4HANA
7 1 (0.065%) ContrOCC
7 1 (0.065%) Payment Gateway
7 1 (0.065%) PeopleSoft HCM
7 1 (0.065%) Primavera
7 1 (0.065%) Sage X3
7 1 (0.065%) SAP MM
7 1 (0.065%) SAP PM
7 1 (0.065%) Sparx Enterprise Architect
7 1 (0.065%) Visualfiles
Cloud Services
1 270 (17.66%) Azure
2 195 (12.75%) AWS
3 190 (12.43%) Microsoft 365
4 107 (7.00%) Power Platform
5 101 (6.61%) GCP
6 94 (6.15%) Azure DevOps
7 44 (2.88%) SaaS
8 34 (2.22%) Entra ID
9 29 (1.90%) AWS CloudFormation
10 21 (1.37%) Power Automate
11 20 (1.31%) OneDrive
12 17 (1.11%) PaaS
12 17 (1.11%) PowerApps
13 14 (0.92%) WhatsApp
14 13 (0.85%) Cloud Computing
15 11 (0.72%) IaaS
16 9 (0.59%) Dynamics 365
17 8 (0.52%) Collibra
17 8 (0.52%) GitHub
18 7 (0.46%) Serverless
Communications & Networking
1 77 (5.04%) DNS
2 73 (4.77%) DHCP
3 70 (4.58%) Firewall
4 55 (3.60%) TCP/IP
5 33 (2.16%) WAN
6 30 (1.96%) HTTP
7 28 (1.83%) SAN
8 25 (1.64%) Intranet
9 24 (1.57%) SD-WAN
10 23 (1.50%) Broadband
11 22 (1.44%) VPN
12 20 (1.31%) Internet
13 19 (1.24%) Network Security
13 19 (1.24%) Wireless
14 18 (1.18%) LAN
15 16 (1.05%) iSCSI
16 14 (0.92%) Remote Desktop
16 14 (0.92%) Wi-Fi
17 9 (0.59%) MPLS
17 9 (0.59%) SNMP
Database & Business Intelligence
1 87 (5.69%) Power BI
2 77 (5.04%) Data Warehouse
3 75 (4.91%) BigQuery
4 72 (4.71%) Looker
5 38 (2.49%) SQL Server
6 22 (1.44%) Relational Database
7 20 (1.31%) GIS
8 18 (1.18%) Amazon RDS
9 17 (1.11%) Geospatial Data
10 16 (1.05%) PostgreSQL
11 15 (0.98%) Tableau
12 14 (0.92%) MS Access
13 13 (0.85%) MySQL
13 13 (0.85%) NoSQL
14 8 (0.52%) Big Data
14 8 (0.52%) Metadata
15 7 (0.46%) RDBMS
16 5 (0.33%) Azure SQL Database
16 5 (0.33%) DynamoDB
16 5 (0.33%) MongoDB
Development Applications
1 42 (2.75%) Git
2 38 (2.49%) JIRA
3 23 (1.50%) Jenkins
4 17 (1.11%) Selenium
5 12 (0.78%) Rational DOORS
6 9 (0.59%) Oracle Forms
7 7 (0.46%) Spinnaker
7 7 (0.46%) Subversion
7 7 (0.46%) Visual Studio
8 6 (0.39%) Sourcetree
9 5 (0.33%) Clang
9 5 (0.33%) Cypress.io
9 5 (0.33%) Team Foundation Server
10 3 (0.20%) Android Studio
10 3 (0.20%) Appium
10 3 (0.20%) Bitbucket
10 3 (0.20%) Cucumber
10 3 (0.20%) JMeter
10 3 (0.20%) Postman
10 3 (0.20%) Rational Rhapsody
General
1 545 (35.64%) Social Skills
2 471 (30.80%) Finance
3 225 (14.72%) Analytical Skills
4 159 (10.40%) Inclusion and Diversity
5 121 (7.91%) Organisational Skills
6 88 (5.76%) Marketing
7 84 (5.49%) Billing
8 78 (5.10%) Legal
9 76 (4.97%) Law
10 75 (4.91%) Retail
11 68 (4.45%) Manufacturing
12 63 (4.12%) Public Sector
13 42 (2.75%) Telecoms
14 40 (2.62%) Influencing Skills
15 36 (2.35%) Electronics
16 35 (2.29%) Pharmaceutical
17 34 (2.22%) Presentation Skills
18 30 (1.96%) Aerospace
18 30 (1.96%) Local Government
19 27 (1.77%) Fire and Rescue
Job Titles
1 230 (15.04%) Senior
2 227 (14.85%) Lead
3 111 (7.26%) Project Manager
4 90 (5.89%) Data Manager
5 88 (5.76%) IT Manager
6 86 (5.62%) Developer
7 84 (5.49%) Engineering Manager
7 84 (5.49%) Team Leader
8 82 (5.36%) Analyst
9 60 (3.92%) Senior Manager
10 51 (3.34%) IT Technician
11 48 (3.14%) Service Manager
12 42 (2.75%) Architect
13 41 (2.68%) Help Desk Technician
14 36 (2.35%) Infrastructure Manager
15 35 (2.29%) Delivery Manager
15 35 (2.29%) Portfolio Manager
16 33 (2.16%) Infrastructure Engineer
17 32 (2.09%) Software Engineer
17 32 (2.09%) Solutions Architect
Libraries, Frameworks & Software Standards
1 66 (4.32%) HTML
2 48 (3.14%) .NET
3 36 (2.35%) CSS
4 33 (2.16%) OpenID
5 32 (2.09%) SAML
6 28 (1.83%) React
7 27 (1.77%) EDI
8 22 (1.44%) Node.js
9 18 (1.18%) AngularJS
10 15 (0.98%) LLVM
11 13 (0.85%) ASP.NET
12 12 (0.78%) Vue
13 11 (0.72%) jQuery
13 11 (0.72%) RESTful
14 10 (0.65%) .NET Framework
14 10 (0.65%) XML
15 9 (0.59%) Flask
15 9 (0.59%) JSON
16 7 (0.46%) React Native
16 7 (0.46%) Spring
Miscellaneous
1 134 (8.76%) Management Information System
2 122 (7.98%) Product Ownership
3 83 (5.43%) Self-Motivation
4 57 (3.73%) Driving Licence
5 51 (3.34%) Housing Association
6 41 (2.68%) Cloud Native
6 41 (2.68%) PMI
7 36 (2.35%) Cyberattack
8 31 (2.03%) Social Media
9 25 (1.64%) Data Centre
10 22 (1.44%) NHS
11 17 (1.11%) IoT
12 15 (0.98%) Onboarding
13 14 (0.92%) Cyber Threat
13 14 (0.92%) Data Protection Act
13 14 (0.92%) iPad
13 14 (0.92%) Mobile App
14 13 (0.85%) Operational Technology
15 12 (0.78%) Enterprise Software
15 12 (0.78%) Low-Code
Operating Systems
1 143 (9.35%) Windows
2 70 (4.58%) Windows Server
3 58 (3.79%) Linux
4 27 (1.77%) Windows 10
5 19 (1.24%) Windows Server 2016
6 18 (1.18%) Windows Server 2019
7 13 (0.85%) Apple iOS
8 7 (0.46%) Windows Server 2012
9 6 (0.39%) Android
10 5 (0.33%) VMS
11 3 (0.20%) Red Hat Enterprise Linux
11 3 (0.20%) Unix
12 2 (0.13%) Windows 7
12 2 (0.13%) Windows 8
13 1 (0.065%) CentOS
13 1 (0.065%) Debian
13 1 (0.065%) Mac OS
13 1 (0.065%) Scientific Linux
13 1 (0.065%) Ubuntu
Processes & Methodologies
1 454 (29.69%) Agile
2 337 (22.04%) Project Management
3 309 (20.21%) Problem-Solving
4 249 (16.29%) Mentoring
5 209 (13.67%) Continuous Improvement
6 207 (13.54%) Customer Service
7 200 (13.08%) Coaching
8 176 (11.51%) Project Delivery
9 164 (10.73%) ITIL
10 161 (10.53%) DevOps
11 149 (9.74%) Roadmaps
12 141 (9.22%) Scrum
13 119 (7.78%) Stakeholder Management
14 118 (7.72%) Decision-Making
15 117 (7.65%) CI/CD
16 116 (7.59%) Business Intelligence
17 111 (7.26%) Business Strategy
18 106 (6.93%) Change Management
19 98 (6.41%) Service Delivery
20 95 (6.21%) Cybersecurity
Programming Languages
1 117 (7.65%) SQL
2 68 (4.45%) JavaScript
3 67 (4.38%) C#
4 59 (3.86%) Java
5 53 (3.47%) Python
6 21 (1.37%) PowerShell
7 19 (1.24%) C
8 18 (1.18%) Data Analysis Expressions
9 16 (1.05%) R
10 12 (0.78%) PHP
11 11 (0.72%) C++
11 11 (0.72%) Scala
12 9 (0.59%) T-SQL
13 8 (0.52%) Ruby
14 7 (0.46%) VBA
15 6 (0.39%) VB
15 6 (0.39%) VB6
16 5 (0.33%) Fortran
17 4 (0.26%) Go
17 4 (0.26%) MATLAB
Qualifications
1 261 (17.07%) Degree
2 136 (8.89%) Security Cleared
3 111 (7.26%) DBS Check
4 73 (4.77%) SC Cleared
5 59 (3.86%) PMI Certification
6 48 (3.14%) PMP
7 34 (2.22%) DV Cleared
8 29 (1.90%) AWS Certification
8 29 (1.90%) AWS Certified Solutions Architect
9 26 (1.70%) Computer Science Degree
10 25 (1.64%) APMP
10 25 (1.64%) BPSS Clearance
10 25 (1.64%) CAPM
10 25 (1.64%) PgMP
11 19 (1.24%) ITIL Certification
12 16 (1.05%) Azure Certification
12 16 (1.05%) Cisco Certification
12 16 (1.05%) ISEB
13 14 (0.92%) CISSP
13 14 (0.92%) Microsoft Certification
Quality Assurance & Compliance
1 169 (11.05%) QA
2 59 (3.86%) SLA
3 54 (3.53%) GDPR
4 41 (2.68%) PMO
5 34 (2.22%) ISO/IEC 27001
6 32 (2.09%) ISO 9001
7 27 (1.77%) GMP
8 26 (1.70%) Data Quality
9 25 (1.64%) Cyber Essentials
10 19 (1.24%) Accessibility
11 12 (0.78%) ISO 14001
11 12 (0.78%) NCSC
12 9 (0.59%) NEBOSH
12 9 (0.59%) NIST
13 8 (0.52%) COSHH
14 7 (0.46%) DO-254
14 7 (0.46%) ISO/IEC 20000
15 5 (0.33%) GxP
15 5 (0.33%) ISO/IEC 17025
16 4 (0.26%) GLP
System Software
1 95 (6.21%) Active Directory
2 85 (5.56%) VMware Infrastructure
3 52 (3.40%) Hyper-V
4 20 (1.31%) Docker
5 19 (1.24%) Firmware
6 18 (1.18%) Virtual Desktop
7 14 (0.92%) vSphere
8 11 (0.72%) VMware ESXi
9 7 (0.46%) IAG
10 6 (0.39%) Microsoft Virtual Server
10 6 (0.39%) Virtual Servers
11 4 (0.26%) pfSense
12 3 (0.20%) Embedded Firmware
12 3 (0.20%) XenDesktop
13 2 (0.13%) BitLocker
13 2 (0.13%) VMware Workstation
13 2 (0.13%) XenApp
14 1 (0.065%) Lustre
14 1 (0.065%) Slurm Workload Manager
Systems Management
1 53 (3.47%) Terraform
2 24 (1.57%) Ansible
3 18 (1.18%) Active Directory Federation Services
4 16 (1.05%) Progress Chef
5 15 (0.98%) Kubernetes
6 14 (0.92%) SCCM
7 12 (0.78%) Opsgenie
7 12 (0.78%) VxRail
7 12 (0.78%) WSUS
7 12 (0.78%) ZABBIX
8 10 (0.65%) FortiGate
8 10 (0.65%) Microsoft Intune
9 8 (0.52%) Failover Clustering
10 7 (0.46%) vCenter Server
11 6 (0.39%) Nagios
12 3 (0.20%) Puppet
13 2 (0.13%) Cisco Prime
13 2 (0.13%) Prometheus
13 2 (0.13%) WhatsUp Gold
14 1 (0.065%) BMC PATROL
Vendors
1 313 (20.47%) Microsoft
2 117 (7.65%) Google
3 91 (5.95%) VMware
4 46 (3.01%) SAP
5 42 (2.75%) Cisco
6 35 (2.29%) Salesforce
6 35 (2.29%) Sophos
7 29 (1.90%) Oracle
8 27 (1.77%) Dell
9 20 (1.31%) Citrix
9 20 (1.31%) Veeam
10 17 (1.11%) NetApp
11 16 (1.05%) Fortinet
12 15 (0.98%) HP
13 13 (0.85%) SolarWinds
14 12 (0.78%) IBM
14 12 (0.78%) Ubiquiti
15 11 (0.72%) CA
15 11 (0.72%) ServiceNow
16 10 (0.65%) Xamarin