Master's Degree Jobs in the UK excluding London

Master's Degree
UK > UK excluding London

The following table provides summary statistics for permanent job vacancies advertised in the UK excluding London with a requirement for Master's Degree qualifications. Included is a benchmarking guide to the salaries offered over the 6 months to 5 May 2024 with a comparison to the same period in the previous 2 years.

6 months to
5 May 2024
Same period 2023 Same period 2022
Rank 238 40 253
Rank change year-on-year -198 +213 +13
Permanent jobs citing Master's Degree 858 4,007 1,017
As % of all permanent jobs advertised in the UK excluding London 1.22% 6.53% 1.43%
As % of the Qualifications category 4.42% 18.01% 4.54%
Number of salaries quoted 433 368 348
10th Percentile £32,500 £22,000 £31,250
25th Percentile £41,250 £40,371 £38,625
Median annual salary (50th Percentile) £55,000 £52,500 £55,000
Median % change year-on-year +4.76% -4.55% +8.64%
75th Percentile £72,500 £72,500 £67,500
90th Percentile £85,000 £86,250 £78,750
UK median annual salary £65,000 £64,987 £70,000
% change year-on-year +0.02% -7.16% +12.00%

All Academic and Professional Certifications
UK excluding London

Master's Degree is in the Academic Qualifications and Professional Certifications category. The following table is for comparison with the above and provides summary statistics for all permanent job vacancies advertised in the UK excluding London with a requirement for academic qualifications or professional certifications.

Permanent vacancies requiring academic qualifications or professional certifications 19,399 22,250 22,402
As % of all permanent jobs advertised in the UK excluding London 27.56% 36.28% 31.50%
Number of salaries quoted 12,216 8,233 10,363
10th Percentile £27,000 £28,000 £27,750
25th Percentile £36,250 £37,039 £36,250
Median annual salary (50th Percentile) £50,000 £51,350 £50,000
Median % change year-on-year -2.63% +2.70% +0.20%
75th Percentile £65,000 £67,500 £63,750
90th Percentile £78,750 £80,000 £76,250
UK median annual salary £54,000 £59,526 £55,000
% change year-on-year -9.28% +8.23% -

Master's Degree
Job Vacancy Trend in the UK excluding London

Job postings citing Master's Degree as a proportion of all IT jobs advertised in the UK excluding London.
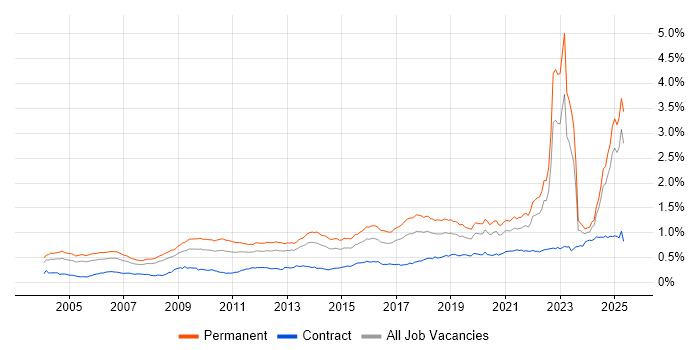
Job vacancy trend for Master's Degree in the UK excluding London

Master's Degree
Salary Trend in the UK excluding London

3-month moving average salary quoted in jobs citing Master's Degree in the UK excluding London.

Salary trend for Master's Degree in the UK excluding London

Master's Degree
Salary Histogram in the UK excluding London

Salary distribution for jobs citing Master's Degree in the UK excluding London over the 6 months to 5 May 2024.

Salary histogram for Master's Degree in the UK excluding London

Master's Degree
Job Locations in the UK excluding London

The table below looks at the demand and provides a guide to the median salaries quoted in IT jobs citing Master's Degree within the UK excluding London region over the 6 months to 5 May 2024. The 'Rank Change' column provides an indication of the change in demand within each location based on the same 6 month period last year.

Location Rank Change
on Same Period
Last Year
Matching
Permanent
IT Job Ads
Median Salary
Past 6 Months
Median Salary
% Change
on Same Period
Last Year
Live
Jobs
South East -101 286 £60,000 - 209
North of England -223 128 £50,000 +12.75% 185
Scotland -110 114 £75,000 +41.51% 41
East of England -105 108 £55,000 -4.35% 142
Midlands -163 99 £55,000 +74.60% 148
South West -160 98 £50,000 +1.27% 100
North West -169 80 £63,750 +2.00% 101
West Midlands -129 59 £52,500 +5.00% 92
East Midlands -130 38 £61,439 +104.80% 56
North East -84 26 £50,000 +4.88% 36
Yorkshire -147 22 £48,750 +9.93% 55
Northern Ireland +20 20 £60,000 - 14
Wales -66 6 £51,250 -34.92% 28
Master's Degree
UK

Master's Degree
Co-occurring Skills and Capabilities in the UK excluding London by Category

The follow tables expand on the table above by listing co-occurrences grouped by category. The same employment type, locality and period is covered with up to 20 co-occurrences shown in each of the following categories:

Application Platforms
1 29 (3.38%) FileNet
2 13 (1.52%) SharePoint
3 8 (0.93%) Apache
4 7 (0.82%) Apache Spark
5 6 (0.70%) IIS
5 6 (0.70%) nginx
6 4 (0.47%) Blackberry Enterprise Server
6 4 (0.47%) Confluence
7 3 (0.35%) SAS
7 3 (0.35%) WordPress
8 2 (0.23%) Microsoft Exchange
9 1 (0.12%) Jupyter
Applications
1 38 (4.43%) Microsoft Excel
2 28 (3.26%) Microsoft Office
3 18 (2.10%) Microsoft PowerPoint
4 14 (1.63%) Simulink
5 12 (1.40%) MS Visio
6 8 (0.93%) Spreadsheet
7 6 (0.70%) InVision
7 6 (0.70%) Sketch
7 6 (0.70%) Trello
7 6 (0.70%) UserZoom
8 5 (0.58%) AutoCAD
9 4 (0.47%) EPLAN
9 4 (0.47%) Microsoft Project
10 3 (0.35%) Adobe XD
11 1 (0.12%) Adobe Creative Suite
Business Applications
1 8 (0.93%) SAP S/4HANA
2 5 (0.58%) SAP MM
3 4 (0.47%) Dynamics CRM
3 4 (0.47%) Shopify
4 3 (0.35%) Dynamics GP
4 3 (0.35%) Primavera
4 3 (0.35%) SAP APO
4 3 (0.35%) SAP PP
4 3 (0.35%) SAP SD
4 3 (0.35%) SAP WM
5 1 (0.12%) Salesforce CRM
5 1 (0.12%) SAP SCM
Cloud Services
1 89 (10.37%) AWS
2 86 (10.02%) Azure
3 62 (7.23%) Power Platform
4 44 (5.13%) GitHub
5 39 (4.55%) Figma
6 37 (4.31%) Amazon S3
7 32 (3.73%) SurveyMonkey
8 24 (2.80%) GCP
9 21 (2.45%) Cloud Computing
10 20 (2.33%) Microsoft 365
10 20 (2.33%) SaaS
11 19 (2.21%) PowerApps
11 19 (2.21%) Serverless
12 17 (1.98%) AWS Lambda
13 14 (1.63%) Power Automate
14 13 (1.52%) IaaS
15 12 (1.40%) Dynamics 365
16 11 (1.28%) OneDrive
16 11 (1.28%) PaaS
16 11 (1.28%) ShareGate
Communications & Networking
1 27 (3.15%) 5G
1 27 (3.15%) Broadband
2 16 (1.86%) TCP/IP
3 14 (1.63%) Internet
4 13 (1.52%) HTTP
5 12 (1.40%) Firewall
6 11 (1.28%) Network Security
7 8 (0.93%) Ethernet
7 8 (0.93%) Wireless
8 6 (0.70%) MQTT
9 5 (0.58%) Intranet
9 5 (0.58%) PPP
9 5 (0.58%) SNMP
9 5 (0.58%) Wi-Fi
10 4 (0.47%) 4G
10 4 (0.47%) LAN
10 4 (0.47%) RS-232
10 4 (0.47%) WAN
10 4 (0.47%) WebEx
11 2 (0.23%) RS-485
Database & Business Intelligence
1 56 (6.53%) Power BI
2 46 (5.36%) NoSQL
3 32 (3.73%) SQL Server
4 30 (3.50%) Apache Cassandra
4 30 (3.50%) Elasticsearch
5 28 (3.26%) Relational Database
6 24 (2.80%) Tableau
7 21 (2.45%) Big Data
8 16 (1.86%) Data Warehouse
8 16 (1.86%) PostgreSQL
9 14 (1.63%) MySQL
10 9 (1.05%) DynamoDB
10 9 (1.05%) GIS
11 7 (0.82%) Snowflake Schema
12 6 (0.70%) Hadoop
12 6 (0.70%) Redis
12 6 (0.70%) Star Schema
13 5 (0.58%) Oracle Reports
14 4 (0.47%) MongoDB
14 4 (0.47%) SQL Server Integration Services
Development Applications
1 59 (6.88%) Git
2 40 (4.66%) Jenkins
3 29 (3.38%) Jasmine
3 29 (3.38%) JUnit
3 29 (3.38%) Mockito
4 16 (1.86%) JIRA
5 10 (1.17%) GitLab
6 4 (0.47%) Subversion
6 4 (0.47%) Team Foundation Server
7 3 (0.35%) Babel
7 3 (0.35%) Bitbucket
7 3 (0.35%) CMake
7 3 (0.35%) SonarQube
7 3 (0.35%) TestRail
7 3 (0.35%) webpack
8 2 (0.23%) ERwin
8 2 (0.23%) Rational DOORS
9 1 (0.12%) Maven
9 1 (0.12%) MSTest
9 1 (0.12%) TestComplete
General
1 308 (35.90%) Social Skills
2 205 (23.89%) Finance
3 158 (18.41%) Analytical Skills
4 154 (17.95%) Inclusion and Diversity
5 143 (16.67%) Marketing
6 127 (14.80%) Law
7 67 (7.81%) Manufacturing
8 58 (6.76%) Legal
9 48 (5.59%) Pharmaceutical
10 36 (4.20%) Electronics
11 34 (3.96%) Social Science
12 33 (3.85%) Retail
13 30 (3.50%) Telecoms
14 26 (3.03%) Banking
15 24 (2.80%) Aerospace
16 22 (2.56%) Presentation Skills
17 20 (2.33%) Automotive
18 14 (1.63%) Military
19 13 (1.52%) Investment Banking
19 13 (1.52%) Organisational Skills
Job Titles
1 144 (16.78%) Senior
2 124 (14.45%) Software Engineer
3 87 (10.14%) Lead
4 76 (8.86%) Developer
5 65 (7.58%) Graduate
6 58 (6.76%) Systems Engineer
7 47 (5.48%) Principal Engineer
8 46 (5.36%) Analyst
9 40 (4.66%) Principal Systems Engineer
10 35 (4.08%) Data Scientist
11 31 (3.61%) Architect
12 30 (3.50%) Software Developer
13 26 (3.03%) Senior Software Engineer
14 22 (2.56%) Junior
15 21 (2.45%) Data Engineer
15 21 (2.45%) Senior Analyst
16 19 (2.21%) Quantity Surveyor
16 19 (2.21%) Senior Developer
17 17 (1.98%) Senior Data Scientist
18 16 (1.86%) User Experience Researcher
Libraries, Frameworks & Software Standards
1 77 (8.97%) AngularJS
2 69 (8.04%) React
3 38 (4.43%) Kafka
4 30 (3.50%) .NET
4 30 (3.50%) GraphQL
5 29 (3.38%) Hibernate
5 29 (3.38%) J2EE
5 29 (3.38%) Spring
5 29 (3.38%) Spring Integration
5 29 (3.38%) Web Services
6 26 (3.03%) RESTful
7 25 (2.91%) HTML
8 17 (1.98%) CSS
9 16 (1.86%) Vue
10 14 (1.63%) OpenACC
10 14 (1.63%) OpenMP
11 13 (1.52%) Flask
11 13 (1.52%) HTML5
12 11 (1.28%) Node.js
12 11 (1.28%) NumPy
Miscellaneous
1 145 (16.90%) Algorithms
2 52 (6.06%) Cloud Native
3 51 (5.94%) Management Information System
4 46 (5.36%) Data Structures
5 45 (5.24%) Driving Licence
6 34 (3.96%) Product Ownership
7 28 (3.26%) Market Risk
8 24 (2.80%) CUDA
9 20 (2.33%) Analytical Mindset
10 19 (2.21%) IoT
11 18 (2.10%) Embedded Systems
11 18 (2.10%) Onboarding
12 17 (1.98%) Life Science
13 15 (1.75%) Data Protection Act
13 15 (1.75%) Security Operations Centre
14 14 (1.63%) Distributed Systems
14 14 (1.63%) Renewable Energy
15 13 (1.52%) Self-Motivation
16 12 (1.40%) Biopharmaceutical
17 10 (1.17%) Robotics
Operating Systems
1 88 (10.26%) Linux
2 37 (4.31%) Windows
3 32 (3.73%) Unix
4 7 (0.82%) FreeRTOS
5 6 (0.70%) Embedded Linux
6 5 (0.58%) Windows Server
7 2 (0.23%) Android
7 2 (0.23%) Windows Server 2012
8 1 (0.12%) Kali Linux
8 1 (0.12%) Windows 10
8 1 (0.12%) Windows Server 2019
Processes & Methodologies
1 368 (42.89%) Computer Science
2 337 (39.28%) Problem-Solving
3 201 (23.43%) Agile
4 181 (21.10%) Software Engineering
5 133 (15.50%) Mathematics
6 130 (15.15%) Analytics
7 128 (14.92%) Machine Learning
8 125 (14.57%) Artificial Intelligence
9 119 (13.87%) Roadmaps
10 98 (11.42%) Data Analysis
11 96 (11.19%) User Experience
12 93 (10.84%) DevOps
13 90 (10.49%) Decision-Making
13 90 (10.49%) Project Management
14 84 (9.79%) Data Science
15 83 (9.67%) CI/CD
16 79 (9.21%) Physics
17 77 (8.97%) Mentoring
18 76 (8.86%) Continuous Improvement
18 76 (8.86%) Data Analytics
Programming Languages
1 246 (28.67%) Python
2 121 (14.10%) SQL
3 95 (11.07%) C
4 76 (8.86%) C#
5 75 (8.74%) C++
5 75 (8.74%) Java
5 75 (8.74%) R
6 58 (6.76%) JavaScript
7 50 (5.83%) Fortran
8 29 (3.38%) MATLAB
9 21 (2.45%) TypeScript
10 20 (2.33%) Bash
11 19 (2.21%) Go
12 16 (1.86%) Rust
13 12 (1.40%) PowerShell
14 10 (1.17%) T-SQL
15 7 (0.82%) Haskell
16 4 (0.47%) Scala
16 4 (0.47%) Shell Script
16 4 (0.47%) VB
Qualifications
1 858 (100.00%) Degree
2 242 (28.21%) PhD
3 183 (21.33%) Computer Science Degree
4 92 (10.72%) MBA
5 55 (6.41%) Security Cleared
6 46 (5.36%) Chartered Engineer
7 17 (1.98%) CISSP
7 17 (1.98%) SC Cleared
8 15 (1.75%) BPSS Clearance
9 12 (1.40%) DV Cleared
10 11 (1.28%) AWS Certification
10 11 (1.28%) ITIL Certification
11 10 (1.17%) CFA
11 10 (1.17%) CIMA
11 10 (1.17%) Cisco Certification
11 10 (1.17%) CompTIA CySA+
11 10 (1.17%) DBS Check
12 9 (1.05%) AWS Certified Solutions Architect
12 9 (1.05%) Numerate Degree
13 8 (0.93%) Azure Certification
Quality Assurance & Compliance
1 44 (5.13%) QA
2 37 (4.31%) GDPR
3 27 (3.15%) Data Quality
4 25 (2.91%) Accessibility
5 14 (1.63%) ISO/IEC 27001
5 14 (1.63%) PCI DSS
5 14 (1.63%) PMO
6 13 (1.52%) NIST
7 11 (1.28%) HIPAA
8 10 (1.17%) California Consumer Privacy Act
9 7 (0.82%) ISO 13485
10 6 (0.70%) NCSC
10 6 (0.70%) WCAG
11 4 (0.47%) Automotive SPICE
11 4 (0.47%) ISO 26262
12 2 (0.23%) Actionable Recommendations
12 2 (0.23%) ECSS
12 2 (0.23%) GLP
12 2 (0.23%) Good Clinical Practice
12 2 (0.23%) IEC 61508
System Software
1 48 (5.59%) Docker
2 15 (1.75%) Active Directory
2 15 (1.75%) Firmware
3 8 (0.93%) VMware Infrastructure
4 5 (0.58%) Hyper-V
5 3 (0.35%) VMware ESXi
6 2 (0.23%) HDFS
7 1 (0.12%) Microsoft Virtual Server
7 1 (0.12%) Snort
7 1 (0.12%) Virtual Machines
7 1 (0.12%) Virtual Servers
Systems Management
1 58 (6.76%) Kubernetes
2 11 (1.28%) Terraform
3 9 (1.05%) CASB
4 4 (0.47%) Functional Safety
5 3 (0.35%) Ansible
6 2 (0.23%) CSIRT
7 1 (0.12%) EMC NetWorker
7 1 (0.12%) Nmap
7 1 (0.12%) SCCM
Vendors
1 88 (10.26%) Microsoft
2 42 (4.90%) EMC
3 38 (4.43%) Qualtrics
4 35 (4.08%) Oracle
5 27 (3.15%) SAP
5 27 (3.15%) Virgin Media
6 21 (2.45%) Google
7 13 (1.52%) Atlassian
8 11 (1.28%) Nintex
9 8 (0.93%) VMware
10 7 (0.82%) Salesforce
11 6 (0.70%) Cisco
11 6 (0.70%) NVIDIA
11 6 (0.70%) YouTube
12 5 (0.58%) BT
13 4 (0.47%) Aruba
13 4 (0.47%) CA
13 4 (0.47%) Databricks
13 4 (0.47%) HP
13 4 (0.47%) ServiceNow