Technology Strategy Jobs in the UK excluding London

Technology Strategy
UK > UK excluding London

The following table provides summary statistics for permanent job vacancies advertised in the UK excluding London with a requirement for Technology Strategy skills. Included is a benchmarking guide to the salaries offered in vacancies that have cited Technology Strategy over the 6 months to 24 April 2024 with a comparison to the same period in the previous 2 years.

6 months to
24 Apr 2024
Same period 2023 Same period 2022
Rank 310 291 304
Rank change year-on-year -19 +13 +43
Permanent jobs citing Technology Strategy 571 715 827
As % of all permanent jobs advertised in the UK excluding London 0.82% 1.15% 1.17%
As % of the Processes & Methodologies category 0.97% 1.20% 1.24%
Number of salaries quoted 259 268 401
10th Percentile £43,150 £52,500 £41,000
25th Percentile £50,086 £60,000 £48,750
Median annual salary (50th Percentile) £57,800 £79,500 £65,000
Median % change year-on-year -27.30% +22.31% +4.00%
75th Percentile £80,313 £96,250 £87,500
90th Percentile £91,500 £117,800 £95,000
UK median annual salary £70,000 £87,500 £77,750
% change year-on-year -20.00% +12.54% +3.67%

All Process and Methodology Skills
UK excluding London

Technology Strategy is in the Processes and Methodologies category. The following table is for comparison with the above and provides summary statistics for all permanent job vacancies advertised in the UK excluding London with a requirement for process or methodology skills.

Permanent vacancies with a requirement for process or methodology skills 59,113 59,506 66,442
As % of all permanent jobs advertised in the UK excluding London 84.56% 95.62% 94.08%
Number of salaries quoted 41,079 30,442 41,567
10th Percentile £27,250 £30,500 £30,000
25th Percentile £36,250 £40,000 £38,750
Median annual salary (50th Percentile) £50,000 £55,000 £52,500
Median % change year-on-year -9.09% +4.76% +9.38%
75th Percentile £65,000 £70,000 £67,500
90th Percentile £77,500 £82,500 £80,000
UK median annual salary £55,000 £62,000 £60,000
% change year-on-year -11.29% +3.33% +9.09%

Technology Strategy
Job Vacancy Trend in the UK excluding London

Job postings citing Technology Strategy as a proportion of all IT jobs advertised in the UK excluding London.
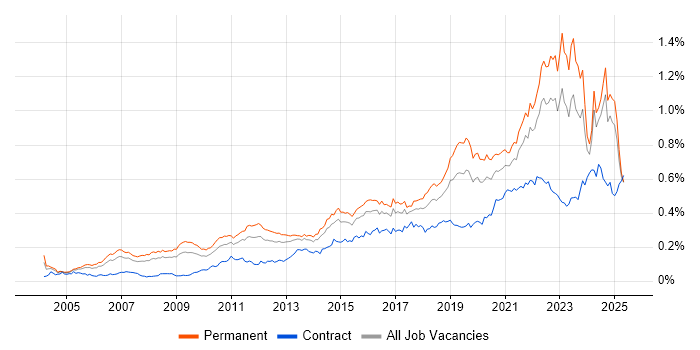
Job vacancy trend for Technology Strategy in the UK excluding London

Technology Strategy
Salary Trend in the UK excluding London

3-month moving average salary quoted in jobs citing Technology Strategy in the UK excluding London.

Salary trend for Technology Strategy in the UK excluding London

Technology Strategy
Salary Histogram in the UK excluding London

Salary distribution for jobs citing Technology Strategy in the UK excluding London over the 6 months to 24 April 2024.

Salary histogram for Technology Strategy in the UK excluding London

Technology Strategy
Job Locations in the UK excluding London

The table below looks at the demand and provides a guide to the median salaries quoted in IT jobs citing Technology Strategy within the UK excluding London region over the 6 months to 24 April 2024. The 'Rank Change' column provides an indication of the change in demand within each location based on the same 6 month period last year.

Location Rank Change
on Same Period
Last Year
Matching
Permanent
IT Job Ads
Median Salary
Past 6 Months
Median Salary
% Change
on Same Period
Last Year
Live
Jobs
North of England -2 138 £60,000 -25.00% 34
South East -13 135 £59,500 -32.00% 25
Scotland -66 103 £70,576 -7.60% 11
Midlands +18 84 £60,000 -18.30% 12
North West -15 78 £56,250 -35.04% 24
South West -30 69 £60,000 +0.80% 11
West Midlands +50 60 £60,000 -18.30% 9
Yorkshire +42 47 £60,249 -23.74% 10
East Midlands -25 20 £50,000 -28.57% 3
East of England +24 18 £55,000 -29.03% 9
North East +10 13 £70,000 -21.13%
Wales -4 12 £51,528 -56.26%
Northern Ireland +28 11 - - 2
Isle of Man - 1 - - 1
Technology Strategy
UK

Technology Strategy
Co-occurring Skills and Capabilities in the UK excluding London by Category

The follow tables expand on the table above by listing co-occurrences grouped by category. The same employment type, locality and period is covered with up to 20 co-occurrences shown in each of the following categories:

Application Platforms
1 23 (4.03%) Confluence
2 17 (2.98%) SAS
3 15 (2.63%) Apache
3 15 (2.63%) Apache Spark
4 5 (0.88%) CMS
5 3 (0.53%) NServiceBus
5 3 (0.53%) SharePoint
6 2 (0.35%) JBoss
6 2 (0.35%) Oracle Workflow
7 1 (0.18%) Microsoft Exchange
Applications
1 2 (0.35%) Microsoft Excel
1 2 (0.35%) MS Visio
2 1 (0.18%) Microsoft Office
Business Applications
1 11 (1.93%) NetSuite
2 5 (0.88%) Dynamics NAV
3 4 (0.70%) Oracle Applications
4 2 (0.35%) Dynamics GP
4 2 (0.35%) Temenos T24
5 1 (0.18%) Dynamics CRM
Cloud Services
1 148 (25.92%) Azure
2 79 (13.84%) Entra ID
3 59 (10.33%) AWS
4 25 (4.38%) GCP
5 19 (3.33%) Microsoft 365
6 13 (2.28%) Cloud Computing
7 12 (2.10%) SaaS
8 10 (1.75%) Azure DevOps
9 8 (1.40%) Power Platform
10 7 (1.23%) Azure Stack
11 6 (1.05%) ChatGPT
11 6 (1.05%) Datadog
12 5 (0.88%) GitHub
13 4 (0.70%) Azure Service Bus
13 4 (0.70%) Azure Synapse Analytics
13 4 (0.70%) Dynamics 365
13 4 (0.70%) GitHub Actions
13 4 (0.70%) OCI
13 4 (0.70%) PowerApps
14 3 (0.53%) Commercetools
Communications & Networking
1 67 (11.73%) 5G
1 67 (11.73%) Broadband
2 6 (1.05%) Firewall
3 3 (0.53%) Network Security
4 2 (0.35%) Internet
5 1 (0.18%) Asterisk PBX
5 1 (0.18%) PBX
5 1 (0.18%) RTP
5 1 (0.18%) VoIP
Database & Business Intelligence
1 26 (4.55%) SQL Server
2 21 (3.68%) MySQL
3 19 (3.33%) Relational Database
4 18 (3.15%) Data Warehouse
5 7 (1.23%) Ingres
5 7 (1.23%) PostgreSQL
6 5 (0.88%) Azure SQL Database
6 5 (0.88%) Big Data
6 5 (0.88%) Data Lake
6 5 (0.88%) Power BI
6 5 (0.88%) SQL Server Reporting Services
7 4 (0.70%) Oracle Database
7 4 (0.70%) QualityStage
8 3 (0.53%) Tableau
9 2 (0.35%) Data Mining
9 2 (0.35%) SQL Server Integration Services
10 1 (0.18%) DynamoDB
10 1 (0.18%) Electronic Patient Records
10 1 (0.18%) NoSQL
10 1 (0.18%) RDBMS
Development Applications
1 40 (7.01%) JIRA
2 15 (2.63%) Maven
3 14 (2.45%) Git
4 3 (0.53%) Appium
4 3 (0.53%) JMeter
4 3 (0.53%) Selenium
5 1 (0.18%) Jenkins
General
1 196 (34.33%) Social Skills
2 172 (30.12%) Finance
3 147 (25.74%) Inclusion and Diversity
4 113 (19.79%) Analytical Skills
5 74 (12.96%) Law
6 71 (12.43%) Marketing
7 58 (10.16%) Banking
8 37 (6.48%) Retail
9 35 (6.13%) Public Sector
10 23 (4.03%) Influencing Skills
11 20 (3.50%) Presentation Skills
12 17 (2.98%) Investment Banking
13 16 (2.80%) Publishing
14 14 (2.45%) Legal
15 9 (1.58%) Retail Finance
16 7 (1.23%) Manufacturing
16 7 (1.23%) Spanish Language
17 6 (1.05%) Telecoms
18 3 (0.53%) Documentation Skills
18 3 (0.53%) Organisational Skills
Job Titles
1 156 (27.32%) Architect
2 119 (20.84%) Solutions Architect
3 90 (15.76%) Presales Solution Architect
4 79 (13.84%) Senior
5 67 (11.73%) Linux Specialist
5 67 (11.73%) Technical Specialist
6 60 (10.51%) Lead
7 38 (6.65%) Senior Data Warehouse Specialist
7 38 (6.65%) Senior Linux Specialist
7 38 (6.65%) Senior Technical Specialist
7 38 (6.65%) Senior Unix Technical Specialist
8 35 (6.13%) Analyst
9 33 (5.78%) Software Engineer
10 25 (4.38%) Lead Architect
11 23 (4.03%) Developer
11 23 (4.03%) Enterprise Architect
11 23 (4.03%) Software Engineering Director
12 22 (3.85%) IT Manager
13 18 (3.15%) Lead Enterprise Architect
13 18 (3.15%) Product Manager
Libraries, Frameworks & Software Standards
1 32 (5.60%) React
2 29 (5.08%) .NET
3 15 (2.63%) Spring
3 15 (2.63%) Spring Boot
4 13 (2.28%) EDI
5 12 (2.10%) CSS
5 12 (2.10%) Node.js
6 10 (1.75%) ASP.NET
6 10 (1.75%) HTML
7 5 (0.88%) .NET Framework
7 5 (0.88%) Next.js
8 4 (0.70%) HTML5
8 4 (0.70%) Laravel
8 4 (0.70%) React Native
8 4 (0.70%) Tailwind CSS
9 3 (0.53%) ASP.NET Web Forms
9 3 (0.53%) GraphQL
9 3 (0.53%) Sass
9 3 (0.53%) Twitter Bootstrap
9 3 (0.53%) WCF
Miscellaneous
1 67 (11.73%) Social Media
2 42 (7.36%) Cloud Native
3 32 (5.60%) Product Ownership
4 25 (4.38%) Management Information System
5 22 (3.85%) Enterprise Software
6 15 (2.63%) Credit Risk
6 15 (2.63%) Distributed Applications
7 14 (2.45%) Freedom of Information
7 14 (2.45%) Taxonomies
8 10 (1.75%) Public Cloud
8 10 (1.75%) Virtual Team
9 8 (1.40%) Data Centre
9 8 (1.40%) Distributed Systems
9 8 (1.40%) Mobile App
10 6 (1.05%) Greenfield Project
11 5 (0.88%) Hackathon
12 4 (0.70%) IoT
13 3 (0.53%) Cyber Defence
13 3 (0.53%) Hybrid Cloud
13 3 (0.53%) Mobile Banking
Operating Systems
1 85 (14.89%) Linux
2 68 (11.91%) Ubuntu
3 20 (3.50%) Windows
4 9 (1.58%) Windows Server
5 8 (1.40%) CentOS
6 7 (1.23%) Debian
6 7 (1.23%) SUSE
7 1 (0.18%) Unix
Processes & Methodologies
1 442 (77.41%) IT Strategy
2 186 (32.57%) Agile
3 164 (28.72%) Problem-Solving
4 141 (24.69%) Business Case
5 133 (23.29%) Analytics
6 130 (22.77%) Artificial Intelligence
7 125 (21.89%) Roadmaps
8 116 (20.32%) Cybersecurity
9 102 (17.86%) Thought Leadership
10 96 (16.81%) Digital Transformation Programme
11 94 (16.46%) Presales
12 91 (15.94%) Commercial Awareness
13 90 (15.76%) Contract Negotiation
14 89 (15.59%) Business Strategy
15 85 (14.89%) CRM
16 84 (14.71%) Data Analytics
17 80 (14.01%) Actionable Insight
18 77 (13.49%) Software Engineering
19 73 (12.78%) Mentoring
20 65 (11.38%) Coaching
Programming Languages
1 75 (13.13%) Bash
2 48 (8.41%) Python
3 36 (6.30%) SQL
4 33 (5.78%) JavaScript
5 29 (5.08%) Java
6 21 (3.68%) C#
7 19 (3.33%) T-SQL
8 15 (2.63%) Groovy
8 15 (2.63%) R
9 5 (0.88%) PowerShell
9 5 (0.88%) TypeScript
10 4 (0.70%) PHP
11 3 (0.53%) AWK
11 3 (0.53%) sed
12 2 (0.35%) Shell Script
13 1 (0.18%) Apex Code
13 1 (0.18%) C
13 1 (0.18%) C++
13 1 (0.18%) Go
Qualifications
1 101 (17.69%) Security Cleared
2 91 (15.94%) SC Cleared
3 90 (15.76%) Degree
4 7 (1.23%) DBS Check
5 6 (1.05%) Computer Science Degree
5 6 (1.05%) ITIL Certification
5 6 (1.05%) OCP
5 6 (1.05%) Oracle Certification
6 5 (0.88%) Master's Degree
7 4 (0.70%) AWS Certification
8 3 (0.53%) AWS Certified Solutions Architect
8 3 (0.53%) DV Cleared
8 3 (0.53%) MBA
9 2 (0.35%) (ISC)2 CCSP
9 2 (0.35%) CEH
9 2 (0.35%) CISM
9 2 (0.35%) OSCP
9 2 (0.35%) Postgraduate
9 2 (0.35%) SAFe Agilist
9 2 (0.35%) SAS Certification
Quality Assurance & Compliance
1 18 (3.15%) QA
2 17 (2.98%) ISO/IEC 27001
3 15 (2.63%) CRD IV
3 15 (2.63%) IFRS
3 15 (2.63%) IFRS 9
4 12 (2.10%) Cyber Essentials
5 8 (1.40%) GDPR
6 7 (1.23%) NIST
7 5 (0.88%) Data Quality
8 4 (0.70%) Accessibility
9 3 (0.53%) HMG Infosec
9 3 (0.53%) HMG Security Policy Framework
9 3 (0.53%) JSP 440
9 3 (0.53%) PCI DSS
9 3 (0.53%) RMADS
9 3 (0.53%) SLA
10 2 (0.35%) COBIT
10 2 (0.35%) GRC
11 1 (0.18%) Cyber Essentials PLUS
11 1 (0.18%) NCSC
System Software
1 77 (13.49%) Active Directory
2 4 (0.70%) Hyper-V
3 3 (0.53%) vSphere
4 1 (0.18%) Docker
4 1 (0.18%) Kamailio
4 1 (0.18%) VMware Infrastructure
Systems Management
1 69 (12.08%) Microsoft Intune
2 67 (11.73%) Jamf Pro
3 26 (4.55%) Terraform
4 15 (2.63%) Kubernetes
5 4 (0.70%) CASB
6 3 (0.53%) HP Fortify
7 2 (0.35%) CSIRT
8 1 (0.18%) Ansible
8 1 (0.18%) SCCM
Vendors
1 124 (21.72%) Microsoft
2 67 (11.73%) CyberArk
2 67 (11.73%) Tanium
3 19 (3.33%) Salesforce
4 16 (2.80%) Oracle
5 9 (1.58%) VMware
6 7 (1.23%) MuleSoft
7 5 (0.88%) Cisco
8 4 (0.70%) Veeam
8 4 (0.70%) Veracode
9 3 (0.53%) Citrix
9 3 (0.53%) Databricks
9 3 (0.53%) Dell
9 3 (0.53%) Google
9 3 (0.53%) Splunk
10 2 (0.35%) Aruba
10 2 (0.35%) HP
10 2 (0.35%) Temenos
11 1 (0.18%) NetApp
11 1 (0.18%) Reuters