IT Strategy Jobs in the UK excluding London

IT/Technology Strategy
UK > UK excluding London

The table below provides summary statistics for permanent job vacancies advertised in the UK excluding London requiring IT Strategy skills. It includes a benchmarking guide to the annual salaries offered in vacancies that cited IT Strategy over the 6 months leading up to 30 May 2025, comparing them to the same period in the previous two years.

6 months to
30 May 2025
Same period 2024 Same period 2023
Rank 292 224 222
Rank change year-on-year -68 -2 -17
Permanent jobs citing IT Strategy 341 938 943
As % of all permanent jobs advertised in the UK excluding London 0.87% 1.26% 1.63%
As % of the Processes & Methodologies category 0.93% 1.53% 1.70%
Number of salaries quoted 222 608 459
10th Percentile £32,400 £35,675 £41,250
25th Percentile £48,306 £43,750 £50,000
Median annual salary (50th Percentile) £63,375 £57,500 £65,000
Median % change year-on-year +10.22% -11.54% +8.33%
75th Percentile £78,438 £77,500 £88,125
90th Percentile £97,500 £94,125 £100,000
UK median annual salary £68,770 £65,000 £75,000
% change year-on-year +5.80% -13.33% +11.11%

All Process and Methodology Skills
UK excluding London

IT Strategy falls under the Processes and Methodologies category. For comparison with the information above, the following table provides summary statistics for all permanent job vacancies requiring process or methodology skills in the UK excluding London.

Permanent vacancies with a requirement for process or methodology skills 36,483 61,419 55,450
As % of all permanent jobs advertised in the UK excluding London 92.65% 82.37% 95.58%
Number of salaries quoted 17,392 42,187 28,711
10th Percentile £26,250 £27,250 £30,500
25th Percentile £36,750 £36,250 £40,000
Median annual salary (50th Percentile) £51,574 £50,000 £55,000
Median % change year-on-year +3.15% -9.09% +4.76%
75th Percentile £65,000 £65,000 £70,000
90th Percentile £77,500 £77,500 £82,500
UK median annual salary £57,443 £55,000 £60,899
% change year-on-year +4.44% -9.69% +1.50%

IT Strategy
Job Vacancy Trend in the UK excluding London

Job postings citing IT Strategy as a proportion of all IT jobs advertised in the UK excluding London.
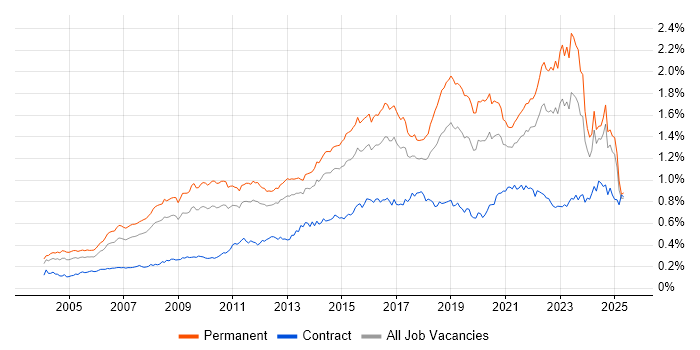
Job vacancy trend for IT Strategy in the UK excluding London

IT Strategy
Salary Trend in the UK excluding London

3-month moving average salary quoted in jobs citing IT Strategy in the UK excluding London.

Salary trend for IT Strategy in the UK excluding London

IT Strategy
Salary Histogram in the UK excluding London

Salary distribution for jobs citing IT Strategy in the UK excluding London over the 6 months to 30 May 2025.

Salary histogram for IT Strategy in the UK excluding London

IT Strategy
Job Locations in the UK excluding London

The table below looks at the demand and provides a guide to the median salaries quoted in IT jobs citing IT Strategy within the UK excluding London region over the 6 months to 30 May 2025. The 'Rank Change' column provides an indication of the change in demand within each location based on the same 6 month period last year.

Location Rank Change
on Same Period
Last Year
Matching
Permanent
IT Job Ads
Median Salary
Past 6 Months
Median Salary
% Change
on Same Period
Last Year
Live
Jobs
South East +13 111 £55,000 -12.00% 366
North of England -89 89 £54,793 -0.38% 285
South West +61 48 £71,250 +5.56% 142
North West -74 45 £54,793 +0.08% 136
Midlands -41 38 £63,500 +15.45% 229
Yorkshire -10 36 £80,000 +28.00% 110
Scotland +45 30 £70,000 +42.86% 84
West Midlands -53 19 £70,000 +16.67% 118
East of England -6 17 £51,500 -23.70% 170
East Midlands +21 16 £63,500 +28.73% 96
North East +30 8 £28,884 -46.26% 41
Northern Ireland +35 6 £130,000 +246.67% 16
Wales +42 3 £63,250 +17.67% 36
Isle of Man +14 1 £34,500 -
IT Strategy
UK

IT Strategy
Co-occurring Skills and Capabilities in the UK excluding London by Category

The follow tables expand on the table above by listing co-occurrences grouped by category. The same employment type, locality and period is covered with up to 20 co-occurrences shown in each of the following categories:

Application Platforms
1 19 (5.57%) Microsoft Exchange
2 14 (4.11%) SharePoint
3 4 (1.17%) IIS
4 2 (0.59%) ArcGIS
4 2 (0.59%) SugarCRM
5 1 (0.29%) CICS
5 1 (0.29%) Confluence
5 1 (0.29%) Jupyter
Applications
1 15 (4.40%) Microsoft Excel
1 15 (4.40%) Microsoft PowerPoint
2 13 (3.81%) Microsoft Office
3 1 (0.29%) AutoCAD
3 1 (0.29%) Chatbot
3 1 (0.29%) Microsoft Project
3 1 (0.29%) MS Visio
Business Applications
1 7 (2.05%) SAP S/4HANA
2 6 (1.76%) Dynamics NAV
3 5 (1.47%) Maximo
4 2 (0.59%) Dynamics AX
4 2 (0.59%) Dynamics CRM
4 2 (0.59%) NetSuite
4 2 (0.59%) SAP Business One
5 1 (0.29%) Elite 3E
5 1 (0.29%) Orchard Housing
5 1 (0.29%) SAP ERP
5 1 (0.29%) Sparx Enterprise Architect
Cloud Services
1 70 (20.53%) Azure
1 70 (20.53%) Microsoft 365
2 32 (9.38%) AWS
3 31 (9.09%) SaaS
4 22 (6.45%) Power Platform
5 16 (4.69%) GCP
6 7 (2.05%) Cloud Computing
7 6 (1.76%) IaaS
7 6 (1.76%) PaaS
7 6 (1.76%) Snowflake
8 5 (1.47%) Dynamics 365
9 4 (1.17%) Entra ID
10 3 (0.88%) GitHub
11 2 (0.59%) Azure Synapse Analytics
11 2 (0.59%) GitHub Actions
11 2 (0.59%) Matillion
11 2 (0.59%) Microsoft Copilot
11 2 (0.59%) Nutanix
11 2 (0.59%) OpenShift
12 1 (0.29%) Amazon EventBridge
Communications & Networking
1 19 (5.57%) Network Security
2 18 (5.28%) Firewall
3 14 (4.11%) NAS
3 14 (4.11%) SAN
4 10 (2.93%) DHCP
4 10 (2.93%) DNS
5 8 (2.35%) VPN
5 8 (2.35%) Wi-Fi
6 7 (2.05%) Internet
6 7 (2.05%) SSL
7 5 (1.47%) DKIM
7 5 (1.47%) DMARC
7 5 (1.47%) IP Telephony
7 5 (1.47%) SNMP
8 4 (1.17%) Wireless
9 3 (0.88%) Cisco Firepower
9 3 (0.88%) LAN
9 3 (0.88%) Unified Communications
9 3 (0.88%) WAN
10 1 (0.29%) VoIP
Database & Business Intelligence
1 16 (4.69%) SQL Server
2 14 (4.11%) Data Warehouse
2 14 (4.11%) Power BI
3 5 (1.47%) GIS
3 5 (1.47%) SAP HANA
4 4 (1.17%) Tableau
5 3 (0.88%) NoSQL
6 2 (0.59%) Big Data
6 2 (0.59%) Data Mining
6 2 (0.59%) EDMS
6 2 (0.59%) Elasticsearch
6 2 (0.59%) MongoDB
6 2 (0.59%) MySQL
6 2 (0.59%) Power Query
6 2 (0.59%) SQL Server Analysis Services
6 2 (0.59%) SQL Server Integration Services
7 1 (0.29%) DB2
7 1 (0.29%) DTS
7 1 (0.29%) Oracle Reports
7 1 (0.29%) PostgreSQL
Development Applications
1 2 (0.59%) IBM UrbanCode
1 2 (0.59%) Jenkins
General
1 144 (42.23%) Social Skills
2 81 (23.75%) Finance
3 37 (10.85%) Legal
4 35 (10.26%) Marketing
5 33 (9.68%) Analytical Skills
6 28 (8.21%) Law
7 27 (7.92%) Inclusion and Diversity
8 22 (6.45%) Influencing Skills
9 18 (5.28%) Manufacturing
10 15 (4.40%) Presentation Skills
11 14 (4.11%) Banking
12 8 (2.35%) Retail
13 6 (1.76%) Public Sector
14 2 (0.59%) Electronics
14 2 (0.59%) Organisational Skills
14 2 (0.59%) Publishing
15 1 (0.29%) Automotive
15 1 (0.29%) Back Office
15 1 (0.29%) Financial Institution
15 1 (0.29%) Telecoms
Job Titles
1 66 (19.35%) Architect
2 58 (17.01%) Lead
3 53 (15.54%) Senior
4 33 (9.68%) Head of IT
4 33 (9.68%) IT Manager
5 26 (7.62%) Corporate Sales Executive
5 26 (7.62%) Enterprise Architect
5 26 (7.62%) Sales Executive
6 25 (7.33%) Solutions Architect
7 20 (5.87%) IT Support
8 17 (4.99%) Cloud Engineer
9 16 (4.69%) IT Engineer
10 14 (4.11%) ERP Manager
11 13 (3.81%) ERP Project Manager
11 13 (3.81%) Project Manager
12 11 (3.23%) Development Manager
12 11 (3.23%) Infrastructure Engineer
12 11 (3.23%) Infrastructure Support Engineer
12 11 (3.23%) IT Support Engineer
12 11 (3.23%) Support Engineer
Libraries, Frameworks & Software Standards
1 7 (2.05%) Android Jetpack
1 7 (2.05%) Jetpack Compose
1 7 (2.05%) OAuth
1 7 (2.05%) SwiftUI
1 7 (2.05%) UIKit
2 5 (1.47%) .NET
2 5 (1.47%) SAP Fiori
2 5 (1.47%) SAPUI5
3 4 (1.17%) React
3 4 (1.17%) REST
4 3 (0.88%) EDI
4 3 (0.88%) JSON
4 3 (0.88%) MACH
5 2 (0.59%) GraphQL
5 2 (0.59%) Kafka
5 2 (0.59%) Spring
6 1 (0.29%) AngularJS
6 1 (0.29%) AWS CDK
6 1 (0.29%) Next.js
6 1 (0.29%) Restlet
Miscellaneous
1 24 (7.04%) Product Ownership
2 19 (5.57%) Enterprise Software
3 17 (4.99%) Management Information System
4 10 (2.93%) Virtual Team
5 8 (2.35%) Cloud Native
6 7 (2.05%) Clustering
7 6 (1.76%) Data Centre
7 6 (1.76%) Mainframe
7 6 (1.76%) Self-Motivation
7 6 (1.76%) Smartphone
8 5 (1.47%) Blackberry
8 5 (1.47%) Hybrid Cloud
8 5 (1.47%) Linux Command Line
9 4 (1.17%) AS400
9 4 (1.17%) Data Protection Act
9 4 (1.17%) iSeries
9 4 (1.17%) Onboarding
9 4 (1.17%) Operational Technology
9 4 (1.17%) Public Cloud
10 3 (0.88%) Security Posture
Operating Systems
1 40 (11.73%) Windows
2 14 (4.11%) Linux
3 12 (3.52%) Windows Server
4 7 (2.05%) Android
4 7 (2.05%) Apple iOS
5 6 (1.76%) Unix
6 5 (1.47%) VMS
7 1 (0.29%) Windows Server 2012
7 1 (0.29%) zOS
Processes & Methodologies
1 184 (53.96%) Technology Strategy
2 134 (39.30%) Roadmaps
3 89 (26.10%) Stakeholder Management
4 66 (19.35%) Project Management
5 54 (15.84%) Strategic Roadmap
6 53 (15.54%) Continuous Improvement
7 52 (15.25%) ERP
8 51 (14.96%) Project Delivery
9 48 (14.08%) Cybersecurity
10 47 (13.78%) Enterprise Architecture
11 46 (13.49%) Agile
11 46 (13.49%) Computer Science
12 44 (12.90%) Problem-Solving
13 41 (12.02%) Technology Roadmap
14 35 (10.26%) ITIL
15 34 (9.97%) Artificial Intelligence
15 34 (9.97%) Business Strategy
15 34 (9.97%) Service Delivery
15 34 (9.97%) Service Management
16 33 (9.68%) Budget Management
Programming Languages
1 29 (8.50%) PowerShell
2 16 (4.69%) SQL
3 12 (3.52%) Java
4 11 (3.23%) Python
5 7 (2.05%) Kotlin
5 7 (2.05%) Swift
6 5 (1.47%) Bash
7 4 (1.17%) JavaScript
7 4 (1.17%) RPG
8 2 (0.59%) JCL
8 2 (0.59%) Progress 4GL
9 1 (0.29%) C#
9 1 (0.29%) PL/SQL
9 1 (0.29%) Shell Script
9 1 (0.29%) TypeScript
Qualifications
1 84 (24.63%) Degree
2 19 (5.57%) Security Cleared
3 13 (3.81%) Computer Science Degree
4 11 (3.23%) HND
4 11 (3.23%) SC Cleared
5 8 (2.35%) Microsoft Certification
6 7 (2.05%) DV Cleared
7 6 (1.76%) TOGAF Certification
8 4 (1.17%) Master's Degree
8 4 (1.17%) PMI Certification
8 4 (1.17%) PMP
9 3 (0.88%) Azure Certification
9 3 (0.88%) ITIL Certification
9 3 (0.88%) VMware Certified Professional (VCP)
10 2 (0.59%) CCNA
10 2 (0.59%) Cisco Certification
10 2 (0.59%) CISSP
10 2 (0.59%) ITIL Foundation Certificate
10 2 (0.59%) MCSA
10 2 (0.59%) MCSE
Quality Assurance & Compliance
1 27 (7.92%) GDPR
2 8 (2.35%) ISO/IEC 27001
3 6 (1.76%) Cyber Essentials
4 4 (1.17%) NIST
4 4 (1.17%) QA
5 3 (0.88%) Accessibility
5 3 (0.88%) SLA
6 2 (0.59%) Data Quality
6 2 (0.59%) ISO/IEC 27002 (supersedes ISO/IEC 17799)
7 1 (0.29%) Actionable Recommendations
7 1 (0.29%) COBIT
7 1 (0.29%) GRC
7 1 (0.29%) PMO
System Software
1 29 (8.50%) Active Directory
2 24 (7.04%) VMware Infrastructure
3 17 (4.99%) Docker
4 9 (2.64%) Hyper-V
5 3 (0.88%) Virtual Machines
6 1 (0.29%) KVM
6 1 (0.29%) Virtual Servers
Systems Management
1 16 (4.69%) Kubernetes
2 10 (2.93%) Microsoft Intune
3 4 (1.17%) SCCM
3 4 (1.17%) SCOM
3 4 (1.17%) SCOrch
4 2 (0.59%) Host Intrusion Detection System
4 2 (0.59%) Terraform
5 1 (0.29%) Ansible
5 1 (0.29%) CA Endevor
5 1 (0.29%) CA Service Virtualization
5 1 (0.29%) Failover Clustering
5 1 (0.29%) Nessus
5 1 (0.29%) OpenVAS
5 1 (0.29%) QRadar
Vendors
1 129 (37.83%) Microsoft
2 42 (12.32%) Cisco
3 32 (9.38%) Dell
4 25 (7.33%) VMware
5 12 (3.52%) SAP
6 5 (1.47%) Apple
6 5 (1.47%) McAfee
6 5 (1.47%) Veeam
7 4 (1.17%) Google
7 4 (1.17%) Oracle
8 3 (0.88%) Databricks
8 3 (0.88%) Meraki
8 3 (0.88%) Sage
8 3 (0.88%) ServiceNow
9 2 (0.59%) Capita
9 2 (0.59%) IBM
9 2 (0.59%) IFS
9 2 (0.59%) Progress
9 2 (0.59%) Red Hat
9 2 (0.59%) Splunk