Technology Strategy Jobs

Technology Strategy
UK

The table below provides summary statistics for permanent job vacancies requiring Technology Strategy skills. It includes a benchmarking guide to the annual salaries offered in vacancies that cited Technology Strategy over the 6 months leading up to 8 November 2024, comparing them to the same period in the previous two years.

6 months to
8 Nov 2024
Same period 2023 Same period 2022
Rank 217 222 296
Rank change year-on-year +5 +74 +68
Permanent jobs citing Technology Strategy 972 944 1,765
As % of all permanent jobs advertised in the UK 1.29% 1.65% 1.30%
As % of the Processes & Methodologies category 1.53% 1.75% 1.35%
Number of salaries quoted 259 468 920
10th Percentile £45,000 £56,675 £52,285
25th Percentile £62,663 £65,327 £65,027
Median annual salary (50th Percentile) £82,822 £79,632 £88,462
Median % change year-on-year +4.01% -9.98% +10.58%
75th Percentile £102,500 £97,163 £106,250
90th Percentile £129,500 £117,500 £115,000
UK excluding London median annual salary £77,500 £76,250 £78,500
% change year-on-year +1.64% -2.87% +12.14%

All Process and Methodology Skills
UK

Technology Strategy falls under the Processes and Methodologies category. For comparison with the information above, the following table provides summary statistics for all permanent job vacancies requiring process or methodology skills.

Permanent vacancies with a requirement for process or methodology skills 63,716 53,794 130,301
As % of all permanent jobs advertised in the UK 84.35% 94.21% 96.03%
Number of salaries quoted 30,127 38,774 76,095
10th Percentile £34,462 £32,500 £34,000
25th Percentile £45,000 £43,867 £45,000
Median annual salary (50th Percentile) £60,000 £60,000 £60,000
Median % change year-on-year - - +4.35%
75th Percentile £78,000 £80,000 £81,250
90th Percentile £96,250 £97,500 £98,750
UK excluding London median annual salary £54,439 £52,500 £52,500
% change year-on-year +3.69% - +5.00%

Technology Strategy
Job Vacancy Trend

Job postings citing Technology Strategy as a proportion of all IT jobs advertised.
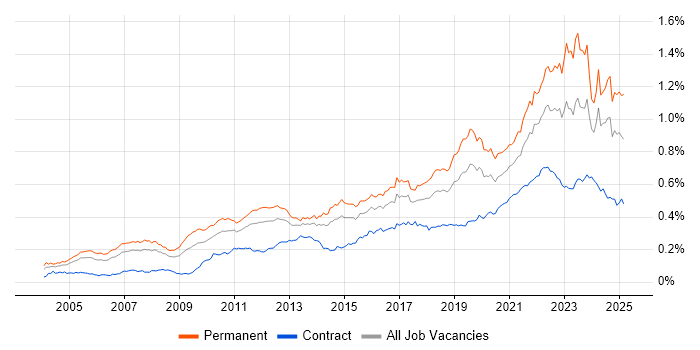
Job vacancy trend for Technology Strategy in the UK

Technology Strategy
Salary Trend

3-month moving average salary quoted in jobs citing Technology Strategy.

Salary trend for Technology Strategy in the UK

Technology Strategy
Salary Histogram

Salary distribution for jobs citing Technology Strategy over the 6 months to 8 November 2024.

Salary histogram for Technology Strategy in the UK

Technology Strategy
Top 16 Job Locations

The table below looks at the demand and provides a guide to the median salaries quoted in IT jobs citing Technology Strategy within the UK over the 6 months to 8 November 2024. The 'Rank Change' column provides an indication of the change in demand within each location based on the same 6 month period last year.

Location Rank Change
on Same Period
Last Year
Matching
Permanent
IT Job Ads
Median Salary
Past 6 Months
Median Salary
% Change
on Same Period
Last Year
Live
Jobs
UK excluding London +15 710 £77,500 +1.64% 149
Work from Home +46 684 £80,000 -1.84% 139
Scotland +86 486 £77,500 +9.81% 10
England -147 446 £84,180 +5.23% 196
London -50 234 £87,500 +2.94% 71
North of England -99 80 £75,000 +6.27% 60
North West -57 57 £72,500 +8.60% 45
Midlands -68 57 £77,500 -3.73% 22
West Midlands -21 35 £76,250 -0.16% 16
South East -86 32 £92,500 +15.63% 26
South West -29 29 £80,000 +0.46% 14
East Midlands -46 22 £80,000 -5.88% 6
Yorkshire -48 21 £82,500 +10.00% 12
Wales +21 17 £65,000 - 5
East of England -55 10 £87,000 +2.35% 9
North East -35 2 £65,000 +26.83% 4

Technology Strategy
Co-occurring Skills and Capabilities by Category

The follow tables expand on the table above by listing co-occurrences grouped by category. The same employment type, locality and period is covered with up to 20 co-occurrences shown in each of the following categories:

Application Platforms
1 18 (1.85%) SAS
2 16 (1.65%) Microsoft Exchange
3 12 (1.23%) SharePoint
4 7 (0.72%) Apache Spark
5 6 (0.62%) ArcGIS
6 2 (0.21%) OpenEdge
7 1 (0.10%) Confluence
7 1 (0.10%) Oracle Application Server
7 1 (0.10%) Oracle SOA Suite
7 1 (0.10%) WebLogic
Applications
1 9 (0.93%) Microsoft Office
2 3 (0.31%) Microsoft PowerPoint
3 2 (0.21%) AutoCAD
3 2 (0.21%) Microsoft Excel
3 2 (0.21%) Oracle Smart View
4 1 (0.10%) Microsoft Project
4 1 (0.10%) Revit
Business Applications
1 12 (1.23%) Dynamics CRM
2 11 (1.13%) Endur
3 6 (0.62%) Oracle ERP
4 5 (0.51%) Dynamics GP
4 5 (0.51%) Dynamics NAV
4 5 (0.51%) Epicor Tropos
4 5 (0.51%) SAP S/4HANA
5 3 (0.31%) Dynamics AX
5 3 (0.31%) Oracle EBS
6 2 (0.21%) iTrent
6 2 (0.21%) NetSuite
7 1 (0.10%) SAP IBP
7 1 (0.10%) SAP MII
7 1 (0.10%) SAP MM
7 1 (0.10%) SAP PP
7 1 (0.10%) SAP SD
Cloud Services
1 119 (12.24%) AWS
2 114 (11.73%) Azure
3 65 (6.69%) GCP
4 51 (5.25%) Cloud Computing
5 46 (4.73%) SaaS
6 40 (4.12%) Power Platform
7 17 (1.75%) Amazon EC2
7 17 (1.75%) Amazon S3
8 16 (1.65%) Dynamics 365
8 16 (1.65%) Microsoft 365
9 13 (1.34%) PaaS
10 12 (1.23%) GitHub
11 11 (1.13%) Snowflake
12 9 (0.93%) Azure Synapse Analytics
12 9 (0.93%) PowerApps
12 9 (0.93%) Serverless
13 8 (0.82%) Azure DevOps
13 8 (0.82%) IaaS
14 7 (0.72%) GitHub Actions
15 6 (0.62%) Power Automate
Communications & Networking
1 532 (54.73%) Broadband
2 18 (1.85%) WAN
3 15 (1.54%) Firewall
4 13 (1.34%) LAN
5 9 (0.93%) SD-WAN
5 9 (0.93%) Wi-Fi
6 7 (0.72%) VPN
7 6 (0.62%) Unified Communications
8 5 (0.51%) Network Security
8 5 (0.51%) Structured Cabling
9 3 (0.31%) BGP
9 3 (0.31%) HSRP
9 3 (0.31%) NAS
9 3 (0.31%) OSPF
9 3 (0.31%) SAN
10 2 (0.21%) 5G
10 2 (0.21%) Internet
10 2 (0.21%) VoIP
10 2 (0.21%) VSAN
10 2 (0.21%) Wireless
Database & Business Intelligence
1 37 (3.81%) Data Warehouse
2 30 (3.09%) Data Mining
2 30 (3.09%) SQL Server
3 29 (2.98%) Power BI
4 25 (2.57%) NoSQL
5 20 (2.06%) Data Lake
6 19 (1.95%) Tableau
7 18 (1.85%) DynamoDB
8 17 (1.75%) Amazon QuickSight
8 17 (1.75%) Amazon Redshift
8 17 (1.75%) Relational Database
9 12 (1.23%) RDBMS
10 9 (0.93%) Big Data
10 9 (0.93%) GIS
11 8 (0.82%) Elasticsearch
11 8 (0.82%) Hadoop
11 8 (0.82%) SQL Server Integration Services
11 8 (0.82%) SQL Server Reporting Services
12 7 (0.72%) Apache Ignite
12 7 (0.72%) MySQL
Development Applications
1 4 (0.41%) GitLab
1 4 (0.41%) Jenkins
1 4 (0.41%) SonarQube
2 3 (0.31%) Git
2 3 (0.31%) TeamCity
3 2 (0.21%) Cucumber
3 2 (0.21%) JIRA
3 2 (0.21%) JUnit
3 2 (0.21%) Mockito
4 1 (0.10%) Artifactory
4 1 (0.10%) Flyway
General
1 611 (62.86%) Social Skills
2 527 (54.22%) Inclusion and Diversity
3 511 (52.57%) Games
4 491 (50.51%) Telecoms
5 117 (12.04%) Finance
6 69 (7.10%) Analytical Skills
7 38 (3.91%) Marketing
8 36 (3.70%) Law
9 29 (2.98%) Manufacturing
10 22 (2.26%) Banking
11 21 (2.16%) Retail
12 16 (1.65%) Presentation Skills
12 16 (1.65%) Public Sector
13 14 (1.44%) Legal
14 12 (1.23%) Local Government
15 9 (0.93%) Influencing Skills
16 6 (0.62%) Back Office
17 5 (0.51%) Pharmaceutical
17 5 (0.51%) Tech for Good
18 4 (0.41%) Financial Institution
Job Titles
1 605 (62.24%) Architect
2 400 (41.15%) Systems Architect
3 243 (25.00%) Principal Architect
4 133 (13.68%) Solutions Architect
5 58 (5.97%) Senior
6 51 (5.25%) Analyst
7 47 (4.84%) Lead
8 45 (4.63%) Principal Solutions Architect
9 40 (4.12%) Cybersecurity Analyst
9 40 (4.12%) Development Analyst
9 40 (4.12%) Security Analyst
10 34 (3.50%) Developer
11 29 (2.98%) Enterprise Architect
12 21 (2.16%) Software Engineer
13 19 (1.95%) Infrastructure Engineer
14 16 (1.65%) Chief Technology Officer
15 15 (1.54%) IT Architect
15 15 (1.54%) IT Engineer
16 14 (1.44%) IT Infrastructure Engineer
16 14 (1.44%) Senior Manager
Libraries, Frameworks & Software Standards
1 50 (5.14%) HTML
1 50 (5.14%) REST
2 46 (4.73%) XML
3 45 (4.63%) CSS
4 23 (2.37%) .NET
5 19 (1.95%) RESTful
6 16 (1.65%) React
7 12 (1.23%) Kafka
8 10 (1.03%) Flutter
8 10 (1.03%) HTML5
9 8 (0.82%) RabbitMQ
9 8 (0.82%) React Native
9 8 (0.82%) Spring
10 7 (0.72%) GraphQL
11 6 (0.62%) Node.js
12 5 (0.51%) Laravel
12 5 (0.51%) OAuth
12 5 (0.51%) OAuth2
12 5 (0.51%) OpenID
12 5 (0.51%) Spring Boot
Miscellaneous
1 48 (4.94%) Onboarding
2 40 (4.12%) Cyber Threat
3 24 (2.47%) Cloud Native
4 21 (2.16%) Data Centre
5 13 (1.34%) Management Information System
6 11 (1.13%) Enterprise Software
6 11 (1.13%) Product Ownership
6 11 (1.13%) Swaptions
7 10 (1.03%) Self-Motivation
8 9 (0.93%) PMI
8 9 (0.93%) Virtual Team
9 8 (0.82%) Distributed Systems
9 8 (0.82%) Team-Oriented Environment
10 7 (0.72%) FMCG
10 7 (0.72%) Greenfield Project
11 6 (0.62%) Driving Licence
11 6 (0.62%) Educational Technology
11 6 (0.62%) Mobile App
12 5 (0.51%) Hackathon
12 5 (0.51%) Legacy Code
Operating Systems
1 17 (1.75%) Windows
2 13 (1.34%) Linux
3 10 (1.03%) Windows Server
4 8 (0.82%) Android
5 5 (0.51%) Apple iOS
6 4 (0.41%) Ubuntu
6 4 (0.41%) Unix
7 1 (0.10%) CentOS
7 1 (0.10%) Windows 10
7 1 (0.10%) Windows Server 2012
Processes & Methodologies
1 807 (83.02%) IT Strategy
2 657 (67.59%) Roadmaps
3 596 (61.32%) Agile
4 548 (56.38%) Technology Roadmap
5 528 (54.32%) Enterprise Architecture
6 506 (52.06%) TOGAF
7 494 (50.82%) Architecture Governance
8 493 (50.72%) Scaled Agile Framework
9 490 (50.41%) Release Train
10 255 (26.23%) Line Management
11 86 (8.85%) Problem-Solving
12 76 (7.82%) Business Strategy
13 75 (7.72%) Cybersecurity
14 73 (7.51%) Analytics
15 68 (7.00%) Microservices
16 61 (6.28%) Continuous Improvement
16 61 (6.28%) Mentoring
17 60 (6.17%) Strategic Roadmap
18 59 (6.07%) Project Management
19 53 (5.45%) Stakeholder Management
Programming Languages
1 82 (8.44%) Java
2 75 (7.72%) Python
3 54 (5.56%) SQL
4 40 (4.12%) Bash
5 26 (2.67%) TypeScript
6 20 (2.06%) C#
7 19 (1.95%) R
8 17 (1.75%) MATLAB
9 14 (1.44%) JavaScript
10 11 (1.13%) VB
11 8 (0.82%) PL/SQL
12 7 (0.72%) PHP
12 7 (0.72%) T-SQL
13 4 (0.41%) PowerShell
13 4 (0.41%) Ruby
14 3 (0.31%) Apex Code
14 3 (0.31%) Kotlin
15 2 (0.21%) C++
15 2 (0.21%) Scala
16 1 (0.10%) Shell Script
Qualifications
1 73 (7.51%) Degree
2 16 (1.65%) Computer Science Degree
2 16 (1.65%) Security Cleared
3 10 (1.03%) PMI Certification
4 9 (0.93%) SC Cleared
5 7 (0.72%) Azure Certification
5 7 (0.72%) BPSS Clearance
6 6 (0.62%) Master's Degree
6 6 (0.62%) RIBA
7 5 (0.51%) Microsoft Certification
7 5 (0.51%) TOGAF Certification
8 4 (0.41%) PRINCE2 Certification
8 4 (0.41%) SAP Certification
9 3 (0.31%) DV Cleared
10 2 (0.21%) AWS Certification
10 2 (0.21%) Cisco Certification
11 1 (0.10%) AWS Certified Solutions Architect
11 1 (0.10%) MCP
11 1 (0.10%) MCSE
11 1 (0.10%) PMP
Quality Assurance & Compliance
1 18 (1.85%) Data Quality
2 17 (1.75%) Accessibility
3 12 (1.23%) GDPR
3 12 (1.23%) QA
4 10 (1.03%) GRC
5 7 (0.72%) NIST
6 6 (0.62%) Cyber Essentials
7 5 (0.51%) ISO/IEC 27001
7 5 (0.51%) SLA
8 4 (0.41%) ISO 20022
8 4 (0.41%) PCI DSS
9 2 (0.21%) ISO 31000
9 2 (0.21%) ITGC
9 2 (0.21%) NCSC
9 2 (0.21%) Sarbanes-Oxley
9 2 (0.21%) SEPA
9 2 (0.21%) SOX 404
10 1 (0.10%) Cyber Essentials PLUS
10 1 (0.10%) PMO
10 1 (0.10%) PSD2
System Software
1 8 (0.82%) Active Directory
1 8 (0.82%) Docker
1 8 (0.82%) Hyper-V
1 8 (0.82%) VMware Infrastructure
2 4 (0.41%) Virtual Machines
3 1 (0.10%) Kamailio
3 1 (0.10%) Virtual Desktop
Systems Management
1 12 (1.23%) Kubernetes
1 12 (1.23%) Terraform
2 3 (0.31%) Ansible
2 3 (0.31%) FortiGate
2 3 (0.31%) Microsoft Intune
3 1 (0.10%) Consul
3 1 (0.10%) Data Guard
3 1 (0.10%) Oracle Enterprise Manager
3 1 (0.10%) Oracle RMAN
3 1 (0.10%) PaperCut
3 1 (0.10%) SCCM
3 1 (0.10%) Single Sign-On
Vendors
1 88 (9.05%) Microsoft
2 52 (5.35%) Google
3 50 (5.14%) Oracle
4 41 (4.22%) Splunk
5 21 (2.16%) Cisco
6 17 (1.75%) SAP
7 12 (1.23%) Salesforce
8 11 (1.13%) OpenLink
8 11 (1.13%) Sybase
8 11 (1.13%) TIBCO
8 11 (1.13%) VMware
9 10 (1.03%) Dell
9 10 (1.03%) NetApp
9 10 (1.03%) Veeam
10 6 (0.62%) Meraki
11 5 (0.51%) Infor
11 5 (0.51%) Kronos
12 4 (0.41%) Citrix
12 4 (0.41%) Zscaler
13 3 (0.31%) Canon