Designer Jobs with Work from Home Options

Designer
UK > Work from Home

The median Designer salary in Work from Home is £50,000 per year according to job vacancies posted during the 6 months to 23 May 2024.

The first table below provides salary benchmarking and summary statistics including a comparison to same period in the previous 2 years.

6 months to
23 May 2024
Same period 2023 Same period 2022
Rank 307 311 172
Rank change year-on-year +4 -139 +87
Permanent jobs requiring a Designer 333 416 1,667
As % of all permanent jobs with a WFH option 0.98% 1.04% 2.32%
As % of the Job Titles category 1.02% 1.08% 2.39%
Number of salaries quoted 281 331 730
10th Percentile £27,750 £39,750 £38,750
25th Percentile £37,500 £45,000 £47,500
Median annual salary (50th Percentile) £50,000 £60,000 £60,000
Median % change year-on-year -16.67% - +20.00%
75th Percentile £60,741 £75,000 £70,000
90th Percentile £70,000 £83,750 £81,375
UK median annual salary £46,855 £57,500 £57,500
% change year-on-year -18.51% - +9.52%

All Permanent IT Job Vacancies
Work from Home

The following table is for comparison with the above and includes summary statistics for all permanent IT job vacancies with a WFH option. Most job vacancies include a discernible job title that can be normalized. As such, the figures in the second row provide an indication of the number of permanent jobs in our overall sample.

Permanent vacancies in Work from Home with a recognized job title 32,644 38,473 69,882
% of permanent jobs with a recognized job title 96.14% 95.93% 97.35%
Number of salaries quoted 24,976 27,318 42,108
10th Percentile £33,250 £36,750 £36,250
25th Percentile £42,500 £47,500 £45,000
Median annual salary (50th Percentile) £56,000 £62,500 £60,000
Median % change year-on-year -10.40% +4.17% +9.09%
75th Percentile £75,000 £81,250 £80,000
90th Percentile £93,750 £100,000 £95,000
UK median annual salary £52,500 £60,000 £60,000
% change year-on-year -12.50% - +9.09%

Designer
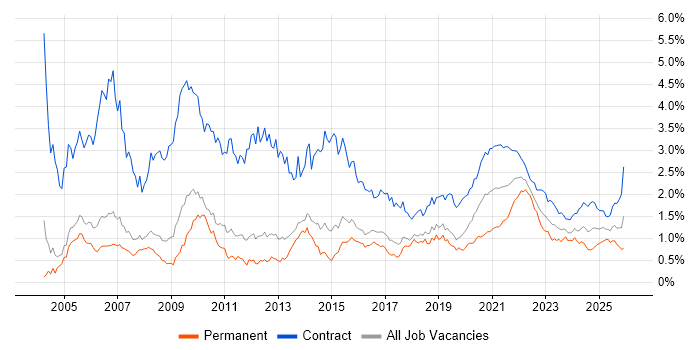
Trend for Jobs with a WFH Option

Job vacancies with a work from home option which featured Designer in the job title as a proportion of all IT jobs advertised.

Designer trend for jobs with a WFH option

Designer
Salary Trend for Jobs with a WFH Option

3-month moving average salary quoted in job vacancies with a work from home option citing Designer.

Designer salary trend for jobs with a WFH option

Designer
Salary Histogram for Jobs with a WFH Option

Salary distribution for jobs with a work from home option citing Designer over the 6 months to 23 May 2024.

Designer salary histogram for jobs with a WFH option

Designer Skill Set
Top 30 Co-occurring Skills and Capabilities in Job Vacancies with WFH Options

For the 6 months to 23 May 2024, Designer job roles required the following skills and capabilities in order of popularity. The figures indicate the absolute number co-occurrences and as a proportion of all permanent jobs with remote work options featuring Designer in the job title.

1 144 (43.24%) User Experience
2 114 (34.23%) UX Design
3 95 (28.53%) Prototyping
4 89 (26.73%) Mentoring
5 86 (25.83%) Adobe
6 84 (25.23%) Agile
6 84 (25.23%) User-Centered Design (UCD)
7 78 (23.42%) Coaching
8 70 (21.02%) User Research
9 68 (20.42%) Figma
10 67 (20.12%) Social Skills
10 67 (20.12%) Marketing
11 63 (18.92%) Accessibility
11 63 (18.92%) Interaction Design
12 56 (16.82%) Wireframes
13 50 (15.02%) Analytics
14 47 (14.11%) Product Ownership
15 45 (13.51%) Finance
15 45 (13.51%) Public Sector
16 43 (12.91%) Photoshop
16 43 (12.91%) Degree
17 41 (12.31%) Graphic Design
17 41 (12.31%) Adobe Illustrator
18 39 (11.71%) Journey Map
18 39 (11.71%) Design Patterns
19 38 (11.41%) Problem-Solving
20 37 (11.11%) Community of Practice
20 37 (11.11%) WCAG
21 36 (10.81%) Service Design
21 36 (10.81%) Content Strategy

Designer Skill Set
Co-occurring Skills and Capabilities with WFH Options by Category

The follow tables expand on the table above by listing co-occurrences grouped by category. The same employment type, locality and period is covered with up to 20 co-occurrences shown in each of the following categories:

Application Platforms
1 10 (3.00%) WordPress
2 3 (0.90%) Confluence
2 3 (0.90%) Totara
3 2 (0.60%) CMS
3 2 (0.60%) IBM Domino
4 1 (0.30%) SharePoint
Applications
1 43 (12.91%) Photoshop
2 41 (12.31%) Adobe Illustrator
3 35 (10.51%) Adobe Creative Suite
4 32 (9.61%) Sketch
5 25 (7.51%) Adobe XD
6 23 (6.91%) InDesign
7 17 (5.11%) Adobe After Effects
8 16 (4.80%) Microsoft PowerPoint
9 9 (2.70%) Microsoft Office
10 8 (2.40%) Simulink
11 7 (2.10%) Adobe Captivate
12 6 (1.80%) Adobe Premiere
12 6 (1.80%) InVision
12 6 (1.80%) Trello
13 4 (1.20%) Blender
14 3 (0.90%) 3ds Max
14 3 (0.90%) CINEMA 4D
15 2 (0.60%) AutoCAD
15 2 (0.60%) Final Cut Pro
15 2 (0.60%) MS Visio
Business Applications
1 5 (1.50%) Oracle General Ledger
1 5 (1.50%) Oracle Subledger Accounting
2 3 (0.90%) Magento
3 2 (0.60%) Shopify
Cloud Services
1 68 (20.42%) Figma
2 11 (3.30%) Adobe Creative Cloud
3 9 (2.70%) SaaS
4 7 (2.10%) AWS
4 7 (2.10%) Azure
4 7 (2.10%) dbt
4 7 (2.10%) WhatsApp
5 5 (1.50%) Miro
5 5 (1.50%) OCI
6 2 (0.60%) Asana
6 2 (0.60%) Canva
6 2 (0.60%) Dialogflow
6 2 (0.60%) Google Analytics
6 2 (0.60%) IBM Watson
7 1 (0.30%) IaaS
7 1 (0.30%) Microsoft 365
7 1 (0.30%) PaaS
7 1 (0.30%) Power Platform
7 1 (0.30%) PowerApps
Communications & Networking
1 2 (0.60%) Cisco Firepower
2 1 (0.30%) Intranet
Database & Business Intelligence
1 5 (1.50%) SAP BW
2 1 (0.30%) Power BI
Development Applications
1 5 (1.50%) Git
1 5 (1.50%) Subversion
2 4 (1.20%) JIRA
3 3 (0.90%) Axure RP
General
1 67 (20.12%) Marketing
1 67 (20.12%) Social Skills
2 45 (13.51%) Finance
2 45 (13.51%) Public Sector
3 31 (9.31%) Retail
4 25 (7.51%) Inclusion and Diversity
5 19 (5.71%) Analytical Skills
6 14 (4.20%) Advertising
7 9 (2.70%) Games
8 8 (2.40%) Publishing
9 6 (1.80%) Multimedia
9 6 (1.80%) Organisational Skills
9 6 (1.80%) Presentation Skills
10 5 (1.50%) Back Office
10 5 (1.50%) Banking
10 5 (1.50%) General Ledger
10 5 (1.50%) Legal
11 4 (1.20%) Automotive
11 4 (1.20%) Manufacturing
11 4 (1.20%) Tech for Good
Libraries, Frameworks & Software Standards
1 31 (9.31%) HTML
2 23 (6.91%) CSS
3 6 (1.80%) React
4 3 (0.90%) EDI
4 3 (0.90%) Next.js
4 3 (0.90%) Sass
5 2 (0.60%) .NET
5 2 (0.60%) Babylonjs
5 2 (0.60%) Three.js
6 1 (0.30%) CarPlay
6 1 (0.30%) SVG
6 1 (0.30%) Unreal Engine
6 1 (0.30%) Web Services
6 1 (0.30%) web3js
Miscellaneous
1 47 (14.11%) Product Ownership
2 41 (12.31%) Graphic Design
3 23 (6.91%) Social Media
4 18 (5.41%) Blockchain
5 12 (3.60%) Animation
5 12 (3.60%) e-Learning
6 8 (2.40%) FPGA
6 8 (2.40%) Photography
6 8 (2.40%) VHDL
6 8 (2.40%) Video Editing
7 7 (2.10%) Mobile App
8 5 (1.50%) Reinsurance
9 4 (1.20%) Self-Motivation
10 3 (0.90%) Digital Media
10 3 (0.90%) Driving Licence
10 3 (0.90%) Learning Management System
10 3 (0.90%) Motion Graphics
10 3 (0.90%) Verilog
11 2 (0.60%) 3D Graphics
11 2 (0.60%) Life Science
Operating Systems
1 1 (0.30%) Android
Processes & Methodologies
1 144 (43.24%) User Experience
2 114 (34.23%) UX Design
3 95 (28.53%) Prototyping
4 89 (26.73%) Mentoring
5 84 (25.23%) Agile
5 84 (25.23%) User-Centered Design (UCD)
6 78 (23.42%) Coaching
7 70 (21.02%) User Research
8 63 (18.92%) Interaction Design
9 56 (16.82%) Wireframes
10 50 (15.02%) Analytics
11 39 (11.71%) Design Patterns
11 39 (11.71%) Journey Map
12 38 (11.41%) Problem-Solving
13 37 (11.11%) Community of Practice
14 36 (10.81%) Content Strategy
14 36 (10.81%) Service Design
15 34 (10.21%) User Stories
16 23 (6.91%) Customer Experience
17 20 (6.01%) Digital Marketing
Programming Languages
1 17 (5.11%) JavaScript
2 5 (1.50%) PHP
3 3 (0.90%) C
3 3 (0.90%) SQL
3 3 (0.90%) SystemVerilog
3 3 (0.90%) TypeScript
4 2 (0.60%) C#
5 1 (0.30%) Kusto Query Language
5 1 (0.30%) Python
Qualifications
1 43 (12.91%) Degree
2 20 (6.01%) Security Cleared
3 12 (3.60%) SC Cleared
4 9 (2.70%) BPSS Clearance
5 5 (1.50%) Oracle Certification
6 2 (0.60%) CCNA
6 2 (0.60%) CCNP
6 2 (0.60%) Cisco Certification
6 2 (0.60%) DBS Check
7 1 (0.30%) AWS Certification
7 1 (0.30%) AWS Certified Solutions Architect
7 1 (0.30%) MCSE
7 1 (0.30%) Microsoft Certification
7 1 (0.30%) RHCSA
Quality Assurance & Compliance
1 63 (18.92%) Accessibility
2 37 (11.11%) WCAG
3 9 (2.70%) GDPR
4 5 (1.50%) GAAP
4 5 (1.50%) IFRS
5 1 (0.30%) Data Quality
5 1 (0.30%) Disclosure Scotland
5 1 (0.30%) NIST
System Software
1 5 (1.50%) Firmware
Vendors
1 86 (25.83%) Adobe
2 11 (3.30%) Microsoft
3 6 (1.80%) SAP
4 5 (1.50%) Oracle
4 5 (1.50%) PeopleSoft
5 4 (1.20%) Hotjar
6 3 (0.90%) Intel
6 3 (0.90%) Microsemi
6 3 (0.90%) Xilinx
7 2 (0.60%) Apple
7 2 (0.60%) Cisco
7 2 (0.60%) Facebook
7 2 (0.60%) Google
7 2 (0.60%) IBM
7 2 (0.60%) Juniper
7 2 (0.60%) Salesforce
7 2 (0.60%) Vectorworks
7 2 (0.60%) WooCommerce
8 1 (0.30%) Thales
8 1 (0.30%) Twitter