Hybrid/Remote UX Design Job Trends

User Experience Design (UXD)
UK > Work from Home

The table below provides summary statistics and salary benchmarking for remote or hybrid work requiring UX Design skills. It covers permanent job vacancies from the 6 months leading up to 24 October 2025, with comparisons to the same periods in the previous two years.

6 months to
24 Oct 2025
Same period 2024 Same period 2023
Rank 185 277 222
Rank change year-on-year +92 -55 -100
Permanent jobs citing UX Design 256 212 333
As % of all permanent jobs with remote/hybrid work options 1.57% 1.05% 1.45%
As % of the Processes & Methodologies category 1.67% 1.19% 1.52%
Number of salaries quoted 114 109 296
10th Percentile £40,375 £39,250 £40,000
25th Percentile £48,238 £47,500 £50,000
Median annual salary (50th Percentile) £61,375 £60,000 £65,000
Median % change year-on-year +2.29% -7.69% +4.00%
75th Percentile £77,500 £68,750 £83,750
90th Percentile £87,500 £80,000 £93,750
UK median annual salary £62,500 £55,000 £65,000
% change year-on-year +13.64% -15.38% +8.33%

All Process and Methodology Skills
Work from Home

UX Design falls under the Processes and Methodologies category. For comparison with the information above, the following table provides summary statistics for all permanent job vacancies with remote or hybrid options requiring process or methodology skills.

Permanent vacancies with a requirement for process or methodology skills 15,305 17,765 21,873
As % of all permanent jobs with a WFH option 93.62% 88.05% 95.14%
Number of salaries quoted 8,409 10,685 17,722
10th Percentile £29,750 £36,000 £37,500
25th Percentile £40,000 £46,250 £47,500
Median annual salary (50th Percentile) £57,500 £62,500 £62,500
Median % change year-on-year -8.00% - -
75th Percentile £77,500 £81,250 £81,000
90th Percentile £100,000 £100,000 £97,500
UK median annual salary £54,625 £60,000 £60,000
% change year-on-year -8.96% - -

UX Design
Job Vacancy Trend for Remote/Hybrid Jobs

Historical trend showing the proportion of permanent IT job postings citing UX Design and offering remote or hybrid work options relative to all permanent IT jobs advertised.
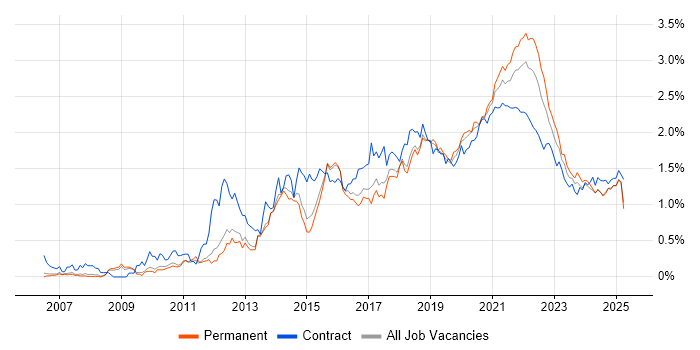
UX Design job vacancy trend for remote/hybrid jobs

UX Design
Salary Trend for Remote/Hybrid Jobs

Salary distribution trend for jobs with remote/hybrid work options citing UX Design.

Salary distribution trend for jobs with remote/hybrid work options citing UX Design

UX Design
Salary Histogram for Remote/Hybrid Jobs

Salary distribution for jobs with remote/hybrid work options citing UX Design over the 6 months to 24 October 2025.

UX Design salary histogram for jobs with remote/hybrid work options

UX Design
Co-Occurring Skills & Capabilities in Remote/Hybrid Jobs by Category

The following tables expand on the one above by listing co-occurrences grouped by category. They cover the same employment type, locality and period, with up to 20 co-occurrences shown in each category:

Application Platforms
1 11 (4.30%) Confluence
2 8 (3.13%) CMS
2 8 (3.13%) Headless CMS
3 5 (1.95%) SharePoint
3 5 (1.95%) WordPress
4 3 (1.17%) Umbraco
5 2 (0.78%) Drupal
Applications
1 21 (8.20%) Adobe XD
2 9 (3.52%) Adobe Creative Suite
3 7 (2.73%) Sketch
4 6 (2.34%) Microsoft Excel
5 4 (1.56%) Adobe Illustrator
5 4 (1.56%) InDesign
5 4 (1.56%) Microsoft Office
5 4 (1.56%) Microsoft PowerPoint
5 4 (1.56%) Photoshop
6 3 (1.17%) MS Visio
7 2 (0.78%) Chatbot
8 1 (0.39%) Adobe After Effects
8 1 (0.39%) Adobe Premiere
8 1 (0.39%) InVision
8 1 (0.39%) Simulink
Business Applications
1 11 (4.30%) Shopify
2 3 (1.17%) Payment Gateway
3 1 (0.39%) Dynamics CRM
Cloud Services
1 54 (21.09%) Figma
2 45 (17.58%) Azure
3 28 (10.94%) AWS
4 21 (8.20%) Google Analytics
4 21 (8.20%) SaaS
5 14 (5.47%) Microsoft 365
6 10 (3.91%) GCP
6 10 (3.91%) Miro
6 10 (3.91%) Serverless
7 9 (3.52%) AWS Lambda
8 8 (3.13%) Amazon ECS
8 8 (3.13%) Amazon S3
8 8 (3.13%) Amazon SQS
8 8 (3.13%) Vercel
9 6 (2.34%) Azure DevOps
9 6 (2.34%) GitHub
10 5 (1.95%) GitHub Actions
10 5 (1.95%) Power Platform
11 4 (1.56%) PowerApps
12 3 (1.17%) Contentsquare
Communications & Networking
1 2 (0.78%) Broadband
2 1 (0.39%) AMQP
2 1 (0.39%) Ethernet
Database & Business Intelligence
1 13 (5.08%) NoSQL
2 5 (1.95%) Power BI
2 5 (1.95%) SQL Server
3 3 (1.17%) MySQL
4 1 (0.39%) Apache Cassandra
4 1 (0.39%) Metadata
4 1 (0.39%) MongoDB
4 1 (0.39%) PostgreSQL
4 1 (0.39%) Relational Database
4 1 (0.39%) Tableau
Development Applications
1 15 (5.86%) Cypress.io
2 14 (5.47%) Git
3 13 (5.08%) JIRA
4 9 (3.52%) Balsamiq
5 8 (3.13%) Axure RP
6 7 (2.73%) Jenkins
7 5 (1.95%) Storybook
8 3 (1.17%) CircleCI
9 2 (0.78%) GitLab
9 2 (0.78%) Selenium
9 2 (0.78%) TeamCity
9 2 (0.78%) Vite
9 2 (0.78%) webpack
10 1 (0.39%) Crashlytics
10 1 (0.39%) fastlane
10 1 (0.39%) JUnit
10 1 (0.39%) Mockito
10 1 (0.39%) Postman
General
1 105 (41.02%) Finance
2 93 (36.33%) Banking
3 57 (22.27%) Social Skills
4 35 (13.67%) Marketing
5 26 (10.16%) Analytical Skills
6 20 (7.81%) Inclusion and Diversity
7 15 (5.86%) Law
7 15 (5.86%) Legal
8 11 (4.30%) Public Sector
9 8 (3.13%) Presentation Skills
10 7 (2.73%) Digital Health
10 7 (2.73%) Organisational Skills
11 4 (1.56%) Telecoms
12 3 (1.17%) Multimedia
12 3 (1.17%) Publishing
12 3 (1.17%) Retail
13 2 (0.78%) Automotive
13 2 (0.78%) Financial Institution
13 2 (0.78%) Games
13 2 (0.78%) Health Technology
Job Titles
1 123 (48.05%) Designer
2 120 (46.88%) Senior
3 105 (41.02%) UX Designer
4 83 (32.42%) Senior Designer
5 81 (31.64%) Senior UX Designer
6 67 (26.17%) Developer
7 31 (12.11%) Senior Developer
8 22 (8.59%) Full-Stack Developer
9 18 (7.03%) Senior Full-Stack Developer
10 16 (6.25%) Lead
11 15 (5.86%) Front-End Developer (Client-Side Developer)
12 13 (5.08%) Product Manager
12 13 (5.08%) Python Developer
13 11 (4.30%) Analyst
13 11 (4.30%) Product Designer
14 10 (3.91%) React Developer
14 10 (3.91%) Senior Python Developer
15 9 (3.52%) Architect
15 9 (3.52%) Front-End Engineer (Client-Side Engineer)
16 8 (3.13%) User Experience Manager
Libraries, Frameworks & Software Standards
1 52 (20.31%) React
2 45 (17.58%) CSS
3 43 (16.80%) HTML
4 19 (7.42%) .NET
4 19 (7.42%) Jest
5 14 (5.47%) GraphQL
5 14 (5.47%) Next.js
5 14 (5.47%) Playwright
6 13 (5.08%) Node.js
6 13 (5.08%) RESTful
7 12 (4.69%) REST
8 11 (4.30%) Django
8 11 (4.30%) Flask
8 11 (4.30%) PySpark
9 10 (3.91%) ASP.NET
9 10 (3.91%) ASP.NET Core
9 10 (3.91%) Tailwind CSS
10 9 (3.52%) CSS3
10 9 (3.52%) HTML5
11 8 (3.13%) Express.js
Miscellaneous
1 20 (7.81%) Product Ownership
2 15 (5.86%) Onboarding
3 9 (3.52%) Mobile App
3 9 (3.52%) Social Media
4 7 (2.73%) Analytical Mindset
4 7 (2.73%) Graphic Design
5 4 (1.56%) AI Agents
6 3 (1.17%) Animation
6 3 (1.17%) Cloud Native
6 3 (1.17%) Motion Graphics
6 3 (1.17%) Reinsurance
7 2 (0.78%) Client/Server
7 2 (0.78%) Data Protection Act
7 2 (0.78%) Greenfield Project
7 2 (0.78%) Midjourney
7 2 (0.78%) Robotics
7 2 (0.78%) VUI
8 1 (0.39%) Distributed Systems
8 1 (0.39%) Infotainment
8 1 (0.39%) Self-Motivation
Operating Systems
1 7 (2.73%) Android
2 6 (2.34%) Apple iOS
3 1 (0.39%) Linux
Processes & Methodologies
1 256 (100.00%) User Experience
2 166 (64.84%) Agile
3 120 (46.88%) User Research
4 113 (44.14%) Wireframes
5 111 (43.36%) Prototyping
6 107 (41.80%) Stakeholder Management
7 104 (40.63%) User-Centered Design (UCD)
8 103 (40.23%) Usability Testing
9 97 (37.89%) Design Thinking
10 96 (37.50%) Project Management
11 90 (35.16%) Journey Map
12 87 (33.98%) UX Research
13 38 (14.84%) Problem-Solving
14 36 (14.06%) Analytics
15 33 (12.89%) DevOps
16 32 (12.50%) Continuous Improvement
17 31 (12.11%) Customer Experience
18 28 (10.94%) Front End Development
19 26 (10.16%) CI/CD
20 23 (8.98%) Full-Stack Development
Programming Languages
1 53 (20.70%) JavaScript
2 39 (15.23%) TypeScript
3 25 (9.77%) C#
3 25 (9.77%) SQL
4 21 (8.20%) Python
5 4 (1.56%) Java
6 3 (1.17%) Go
6 3 (1.17%) PowerShell
6 3 (1.17%) Ruby
6 3 (1.17%) VBA
6 3 (1.17%) XAML
7 2 (0.78%) Bicep
7 2 (0.78%) C
7 2 (0.78%) Kotlin
7 2 (0.78%) PHP
8 1 (0.39%) C++
8 1 (0.39%) MATLAB
8 1 (0.39%) Objective-C
8 1 (0.39%) VB.NET
8 1 (0.39%) VBScript
Qualifications
1 45 (17.58%) Degree
2 14 (5.47%) SC Cleared
2 14 (5.47%) Security Cleared
3 8 (3.13%) Computer Science Degree
4 4 (1.56%) Master's Degree
5 1 (0.39%) CITP
5 1 (0.39%) CREST Certified
5 1 (0.39%) DV Cleared
5 1 (0.39%) Microsoft Certification
5 1 (0.39%) TOGAF Certification
Quality Assurance & Compliance
1 133 (51.95%) Accessibility
2 17 (6.64%) QA
3 16 (6.25%) WCAG
4 3 (1.17%) ISO 9001
4 3 (1.17%) ISO/IEC 27001
5 2 (0.78%) GDPR
5 2 (0.78%) PERC
6 1 (0.39%) Data Quality
System Software
1 6 (2.34%) Docker
Systems Management
1 5 (1.95%) Terraform
2 4 (1.56%) Kubernetes
3 1 (0.39%) Grafana
3 1 (0.39%) Progress Chef
Vendors
1 34 (13.28%) Adobe
2 20 (7.81%) Microsoft
3 16 (6.25%) Google
4 11 (4.30%) Databricks
5 8 (3.13%) Apple
6 4 (1.56%) Guidewire
6 4 (1.56%) Hotjar
7 3 (1.17%) Cisco
8 2 (0.78%) Salesforce
9 1 (0.39%) dotdigital
9 1 (0.39%) QNX