Wireframes Jobs with Work from Home Options

Wireframes (Wireframing)
UK > Work from Home

The table below provides summary statistics for permanent job vacancies with an option to work from home (WFH) and a requirement for Wireframes skills. Included is a benchmarking guide to the salaries offered in vacancies that have cited Wireframes over the 6 months to 25 April 2024 with a comparison to the same period in the previous 2 years.

6 months to
25 Apr 2024
Same period 2023 Same period 2022
Rank 407 428 250
Rank change year-on-year +21 -178 +54
Permanent jobs citing Wireframes 178 256 1,009
As % of all permanent jobs with a WFH option 0.53% 0.59% 1.52%
As % of the Processes & Methodologies category 0.57% 0.61% 1.56%
Number of salaries quoted 135 200 358
10th Percentile £27,700 £41,184 £36,750
25th Percentile £36,250 £45,000 £46,250
Median annual salary (50th Percentile) £54,000 £58,750 £55,000
Median % change year-on-year -8.09% +6.82% +10.00%
75th Percentile £65,000 £75,000 £67,500
90th Percentile £73,250 £83,750 £85,000
UK median annual salary £54,000 £57,500 £55,000
% change year-on-year -6.09% +4.55% +10.00%

All Process and Methodology Skills
Work from Home

Wireframes is in the Processes and Methodologies category. The following table is for comparison with the above and provides summary statistics for all permanent job vacancies with a WFH option and a requirement for process or methodology skills.

Permanent vacancies with a requirement for process or methodology skills 31,024 41,738 64,495
As % of all permanent jobs with a WFH option 91.68% 96.08% 96.90%
Number of salaries quoted 23,594 28,877 41,026
10th Percentile £33,750 £37,500 £36,250
25th Percentile £42,500 £47,500 £45,000
Median annual salary (50th Percentile) £57,500 £62,500 £60,000
Median % change year-on-year -8.00% +4.17% +9.09%
75th Percentile £75,000 £82,500 £80,000
90th Percentile £95,000 £100,000 £95,000
UK median annual salary £55,000 £61,700 £60,000
% change year-on-year -10.86% +2.83% +9.09%

Wireframes
Trend for Jobs with a WFH Option

Job vacancies with a work from home option citing Wireframes as a proportion of all IT jobs advertised.
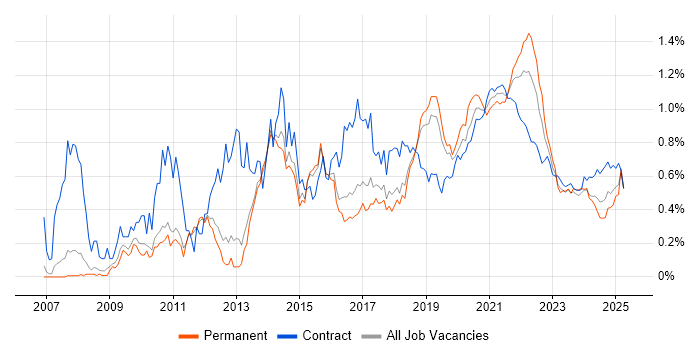
Wireframes trend for jobs with a WFH option

Wireframes
Salary Trend for Jobs with a WFH Option

3-month moving average salary quoted in job vacancies with a work from home option citing Wireframes.

Wireframes salary trend for jobs with a WFH option

Wireframes
Salary Histogram for Jobs with a WFH Option

Salary distribution for jobs with a work from home option citing Wireframes over the 6 months to 25 April 2024.

Wireframes salary histogram for jobs with a WFH option

Wireframes
Co-occurring Skills and Capabilities with WFH Options by Category

The follow tables expand on the table above by listing co-occurrences grouped by category. The same employment type, locality and period is covered with up to 20 co-occurrences shown in each of the following categories:

Application Platforms
1 7 (3.93%) CMS
2 3 (1.69%) Sitecore CMS
3 2 (1.12%) Umbraco
3 2 (1.12%) WordPress
4 1 (0.56%) Confluence
4 1 (0.56%) IIS
Applications
1 30 (16.85%) Adobe XD
2 28 (15.73%) Sketch
3 14 (7.87%) Photoshop
4 13 (7.30%) Adobe Illustrator
4 13 (7.30%) Microsoft Office
4 13 (7.30%) Microsoft PowerPoint
5 12 (6.74%) Microsoft Excel
6 11 (6.18%) Adobe Creative Suite
7 10 (5.62%) InVision
8 9 (5.06%) InDesign
9 4 (2.25%) MS Visio
10 3 (1.69%) Adobe After Effects
10 3 (1.69%) Blender
10 3 (1.69%) CINEMA 4D
10 3 (1.69%) Trello
10 3 (1.69%) UserZoom
11 1 (0.56%) Acrobat
11 1 (0.56%) Zeplin
Business Applications
1 3 (1.69%) Dynamics CRM
2 2 (1.12%) Oracle ERP
2 2 (1.12%) Shopify
Cloud Services
1 43 (24.16%) Figma
2 15 (8.43%) AWS
3 12 (6.74%) Dynamics 365
4 8 (4.49%) Power Platform
5 7 (3.93%) Microsoft 365
5 7 (3.93%) SaaS
6 6 (3.37%) Azure
7 4 (2.25%) Google Analytics
7 4 (2.25%) WhatsApp
8 3 (1.69%) Azure DevOps
8 3 (1.69%) GitHub
9 2 (1.12%) GCP
9 2 (1.12%) Miro
10 1 (0.56%) Salesforce Sales Cloud
10 1 (0.56%) Salesforce Service Cloud
Communications & Networking
1 6 (3.37%) Intranet
2 1 (0.56%) Internet
Database & Business Intelligence
1 10 (5.62%) PostgreSQL
2 7 (3.93%) Power BI
3 6 (3.37%) MongoDB
4 5 (2.81%) SQL Server
5 3 (1.69%) MySQL
Development Applications
1 15 (8.43%) Axure RP
2 14 (7.87%) JIRA
3 13 (7.30%) Balsamiq
4 9 (5.06%) Git
4 9 (5.06%) GitLab
4 9 (5.06%) Jenkins
5 5 (2.81%) Visual Studio
6 4 (2.25%) Visual Studio Code
7 1 (0.56%) Selenium
General
1 93 (52.25%) Social Skills
2 48 (26.97%) Finance
3 38 (21.35%) Marketing
4 28 (15.73%) Analytical Skills
4 28 (15.73%) Inclusion and Diversity
5 26 (14.61%) Law
6 25 (14.04%) Public Sector
7 23 (12.92%) Presentation Skills
8 13 (7.30%) Retail
9 7 (3.93%) Automotive
9 7 (3.93%) Banking
10 6 (3.37%) Publishing
11 5 (2.81%) Legal
12 4 (2.25%) Games
12 4 (2.25%) Influencing Skills
13 1 (0.56%) Billing
13 1 (0.56%) Organisational Skills
13 1 (0.56%) Telecoms
Job Titles
1 62 (34.83%) Designer
2 48 (26.97%) UX Designer
3 46 (25.84%) Analyst
4 44 (24.72%) Senior
5 35 (19.66%) Business Analyst
6 19 (10.67%) UI Designer
7 18 (10.11%) UI/UX Designer
8 16 (8.99%) Consultant
8 16 (8.99%) User Experience Consultant
9 14 (7.87%) Full Stack Engineer
10 13 (7.30%) Lead
11 12 (6.74%) Senior Full Stack Engineer
12 11 (6.18%) Developer
12 11 (6.18%) Senior Designer
12 11 (6.18%) Senior UX Designer
13 10 (5.62%) Lead Business Analyst
14 9 (5.06%) Systems Analyst
15 7 (3.93%) Senior Analyst
15 7 (3.93%) Technical Analyst
15 7 (3.93%) Technical Business Analyst
Libraries, Frameworks & Software Standards
1 58 (32.58%) CSS
2 46 (25.84%) HTML
3 19 (10.67%) React
4 11 (6.18%) Django
4 11 (6.18%) RESTful
5 9 (5.06%) Kafka
5 9 (5.06%) RabbitMQ
6 8 (4.49%) AngularJS
7 7 (3.93%) Vue
8 6 (3.37%) .NET
8 6 (3.37%) LAPP Stack
9 5 (2.81%) D3.js
9 5 (2.81%) Sass
10 4 (2.25%) .NET Core
10 4 (2.25%) XHTML
11 3 (1.69%) Blazor
11 3 (1.69%) Ember.js
11 3 (1.69%) Tapestry
11 3 (1.69%) WebGL
12 2 (1.12%) Jest
Miscellaneous
1 33 (18.54%) Product Ownership
2 12 (6.74%) Mobile App
3 10 (5.62%) Cyberattack
4 8 (4.49%) Blockchain
5 6 (3.37%) NHS
6 5 (2.81%) Algorithms
7 4 (2.25%) Cloud Native
7 4 (2.25%) Data Structures
8 3 (1.69%) Animation
8 3 (1.69%) Driving Licence
8 3 (1.69%) Graphic Design
8 3 (1.69%) Management Information System
8 3 (1.69%) Motion Graphics
8 3 (1.69%) Virtual Team
9 2 (1.12%) Data Centre
9 2 (1.12%) Virtual Reality
9 2 (1.12%) W3C
10 1 (0.56%) Housing Association
10 1 (0.56%) Photography
10 1 (0.56%) Renewable Energy
Operating Systems
1 6 (3.37%) Linux
2 5 (2.81%) Windows
3 4 (2.25%) Android
4 3 (1.69%) Apple iOS
Processes & Methodologies
1 115 (64.61%) User Experience
2 83 (46.63%) UX Design
3 70 (39.33%) User Research
4 54 (30.34%) Agile
5 44 (24.72%) Usability Testing
6 42 (23.60%) Problem-Solving
7 41 (23.03%) User-Centered Design (UCD)
8 40 (22.47%) Prototyping
9 27 (15.17%) Information Architecture
9 27 (15.17%) User Stories
10 25 (14.04%) Psychology
11 24 (13.48%) Requirements Gathering
12 22 (12.36%) Business Analysis
12 22 (12.36%) Data Science
12 22 (12.36%) DevOps
12 22 (12.36%) High-Fidelity Prototypes
12 22 (12.36%) Software Engineering
13 21 (11.80%) Translating Business Requirements
13 21 (11.80%) UX Research
14 19 (10.67%) Front End Development
Programming Languages
1 41 (23.03%) JavaScript
2 19 (10.67%) C#
3 18 (10.11%) SQL
4 11 (6.18%) Python
5 9 (5.06%) C
6 8 (4.49%) TypeScript
7 2 (1.12%) PHP
8 1 (0.56%) T-SQL
Qualifications
1 46 (25.84%) Degree
2 13 (7.30%) Microsoft Certification
3 9 (5.06%) Security Cleared
4 8 (4.49%) DV Cleared
5 3 (1.69%) HND
5 3 (1.69%) Master's Degree
6 2 (1.12%) Computer Science Degree
6 2 (1.12%) SC Cleared
7 1 (0.56%) BPSS Clearance
Quality Assurance & Compliance
1 40 (22.47%) Accessibility
2 16 (8.99%) WCAG
3 8 (4.49%) QA
4 6 (3.37%) Actionable Recommendations
4 6 (3.37%) GDPR
System Software
1 9 (5.06%) Docker
Systems Management
1 10 (5.62%) Kubernetes
2 3 (1.69%) logstash
Vendors
1 54 (30.34%) Adobe
2 34 (19.10%) Microsoft
3 8 (4.49%) Hotjar
4 6 (3.37%) Sitecore
5 4 (2.25%) Google
6 3 (1.69%) CrowdStrike
6 3 (1.69%) Oracle
6 3 (1.69%) Qualtrics
7 2 (1.12%) Salesforce
7 2 (1.12%) WooCommerce
8 1 (0.56%) Apple