Data Analysis Contracts in London

Data Analysis
England > London

The table below provides summary statistics for contract job vacancies advertised in London requiring Data Analysis skills. It includes a benchmarking guide to the contractor rates offered in vacancies that cited Data Analysis over the 6 months leading up to 3 June 2025, comparing them to the same period in the previous two years.

6 months to
3 Jun 2025
Same period 2024 Same period 2023
Rank 60 84 83
Rank change year-on-year +24 -1 +17
Contract jobs citing Data Analysis 497 491 760
As % of all contract jobs advertised in London 4.12% 2.80% 2.97%
As % of the Processes & Methodologies category 4.46% 3.17% 3.27%
Number of daily rates quoted 319 334 551
10th Percentile £352 £350 £350
25th Percentile £403 £401 £400
Median daily rate (50th Percentile) £513 £500 £503
Median % change year-on-year +2.50% -0.50% -4.29%
75th Percentile £638 £617 £638
90th Percentile £725 £800 £739
England median daily rate £488 £495 £500
% change year-on-year -1.52% -1.00% -2.44%
Number of hourly rates quoted 24 12 16
10th Percentile £23.92 £27.74 -
25th Percentile £28.95 £41.25 £21.24
Median hourly rate £34.83 £46.25 £22.49
Median % change year-on-year -24.70% +105.69% -36.66%
75th Percentile £50.75 £50.00 £36.59
90th Percentile £63.75 £53.15 £65.63
England median hourly rate £31.64 £29.00 £27.00
% change year-on-year +9.10% +7.41% -22.86%

All Process and Methodology Skills
London

Data Analysis falls under the Processes and Methodologies category. For comparison with the information above, the following table provides summary statistics for all contract job vacancies requiring process or methodology skills in London.

Contract vacancies with a requirement for process or methodology skills 11,139 15,473 23,269
As % of all contract IT jobs advertised in London 92.27% 88.29% 90.93%
Number of daily rates quoted 7,465 11,093 16,861
10th Percentile £350 £340 £375
25th Percentile £430 £449 £475
Median daily rate (50th Percentile) £550 £550 £590
Median % change year-on-year - -6.78% +2.61%
75th Percentile £688 £675 £700
90th Percentile £800 £800 £800
England median daily rate £525 £525 £550
% change year-on-year - -4.55% +0.92%
Number of hourly rates quoted 190 320 265
10th Percentile £16.50 £15.50 £18.00
25th Percentile £24.30 £20.00 £22.49
Median hourly rate £31.67 £28.00 £39.00
Median % change year-on-year +13.12% -28.21% +9.86%
75th Percentile £49.75 £48.75 £64.50
90th Percentile £63.30 £68.08 £82.50
England median hourly rate £28.18 £37.50 £37.15
% change year-on-year -24.85% +0.94% +48.60%

Data Analysis
Job Vacancy Trend in London

Job postings citing Data Analysis as a proportion of all IT jobs advertised in London.
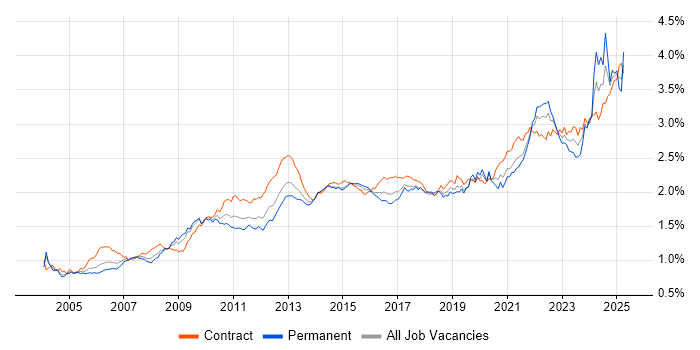
Job vacancy trend for Data Analysis in London

Data Analysis
Contractor Daily Rate Trend in London

3-month moving average daily rate quoted in jobs citing Data Analysis in London.

Daily rate trend for Data Analysis in London

Data Analysis
Daily Rate Histogram in London

Daily rate distribution for jobs citing Data Analysis in London over the 6 months to 3 June 2025.

Daily rate histogram for Data Analysis in London

Data Analysis
Contractor Hourly Rate Trend in London

3-month moving average hourly rates quoted in jobs citing Data Analysis in London.

Hourly rate trend for Data Analysis in London

Data Analysis
Hourly Rate Histogram in London

Hourly rate distribution of jobs citing Data Analysis in London over the 6 months to 3 June 2025.

Hourly rate histogram for Data Analysis in London

Data Analysis
Contract Job Locations in London

The table below looks at the demand and provides a guide to the median contractor rates quoted in IT jobs citing Data Analysis within the London region over the 6 months to 3 June 2025. The 'Rank Change' column provides an indication of the change in demand within each location based on the same 6 month period last year.

Location Rank Change
on Same Period
Last Year
Matching
Contract
IT Job Ads
Median
Daily Rate
Past 6 Months
Median Daily Rate
% Change
on Same Period
Last Year
Live
Jobs
Central London +26 104 £575 +15.00% 38
West London +22 15 £400 -23.81% 160
East London +17 6 £450 -2.44% 10
South London +4 4 - - 14
Data Analysis
England

Data Analysis
Co-occurring Skills and Capabilities in London by Category

The follow tables expand on the table above by listing co-occurrences grouped by category. The same employment type, locality and period is covered with up to 20 co-occurrences shown in each of the following categories:

Application Platforms
1 22 (4.43%) Confluence
2 17 (3.42%) Apache Spark
3 13 (2.62%) IIS
4 11 (2.21%) SharePoint
5 6 (1.21%) SAS
6 4 (0.80%) Apache
7 2 (0.40%) Drupal
8 1 (0.20%) Apache Airflow
8 1 (0.20%) CMS
8 1 (0.20%) IBM HTTP Server
8 1 (0.20%) Microsoft Exchange
8 1 (0.20%) Oracle Workflow
8 1 (0.20%) Sitecore CMS
Applications
1 106 (21.33%) Microsoft Excel
2 20 (4.02%) Microsoft PowerPoint
3 15 (3.02%) Microsoft Office
4 12 (2.41%) MS Visio
5 10 (2.01%) Spreadsheet
6 6 (1.21%) Oracle Smart View
7 4 (0.80%) Microsoft Project
8 2 (0.40%) Chatbot
8 2 (0.40%) Notepad++
9 1 (0.20%) Revit
9 1 (0.20%) Trello
Business Applications
1 15 (3.02%) Dynamics CRM
2 5 (1.01%) SAP S/4HANA
3 4 (0.80%) Aladdin
3 4 (0.80%) Workday HCM
4 3 (0.60%) Endur
5 2 (0.40%) Actimize
5 2 (0.40%) OpenText MBPM
5 2 (0.40%) Oracle BPM
5 2 (0.40%) Oracle Financials
5 2 (0.40%) SAP HR
6 1 (0.20%) Bloomberg AIM
6 1 (0.20%) HFM
6 1 (0.20%) Maximo
6 1 (0.20%) Oracle ERP
6 1 (0.20%) Payment Gateway
6 1 (0.20%) Salesforce CRM
6 1 (0.20%) SAP BPC
6 1 (0.20%) SAP MDG
6 1 (0.20%) Summit
6 1 (0.20%) Unit4 Business World
Cloud Services
1 116 (23.34%) Power Platform
2 64 (12.88%) Azure
3 37 (7.44%) AWS
4 25 (5.03%) GCP
5 12 (2.41%) Azure Data Factory
5 12 (2.41%) Snowflake
6 11 (2.21%) Azure DevOps
6 11 (2.21%) Dynamics 365
7 9 (1.81%) Cloud Computing
8 8 (1.61%) Google Sheets
9 7 (1.41%) Azure Synapse Analytics
9 7 (1.41%) Microsoft 365
10 6 (1.21%) Power Automate
11 5 (1.01%) GitHub
11 5 (1.01%) OCI
11 5 (1.01%) PowerApps
12 4 (0.80%) Google Analytics
13 3 (0.60%) Azure Machine Learning
13 3 (0.60%) Google Workspace
13 3 (0.60%) SaaS
Communications & Networking
1 14 (2.82%) Internet
2 4 (0.80%) SNMP
3 3 (0.60%) Firewall
3 3 (0.60%) Network Security
3 3 (0.60%) Remote Desktop
3 3 (0.60%) SSH
3 3 (0.60%) Telnet
3 3 (0.60%) Wireshark
4 1 (0.20%) BGP
4 1 (0.20%) BIG-IP
4 1 (0.20%) DNS
4 1 (0.20%) HSRP
4 1 (0.20%) IGMP
4 1 (0.20%) Intranet
4 1 (0.20%) IPsec
4 1 (0.20%) Multicast
4 1 (0.20%) OSPF
4 1 (0.20%) SD-WAN
4 1 (0.20%) VPN
4 1 (0.20%) VRRP
Database & Business Intelligence
1 114 (22.94%) Power BI
2 60 (12.07%) Tableau
3 58 (11.67%) SQL Server
4 30 (6.04%) Data Warehouse
5 20 (4.02%) SQL Server Reporting Services
6 18 (3.62%) Oracle Database
7 15 (3.02%) Relational Database
8 13 (2.62%) Looker
8 13 (2.62%) Power Query
9 12 (2.41%) Big Data
9 12 (2.41%) BigQuery
10 11 (2.21%) Oracle Reports
11 10 (2.01%) SQL Server Integration Services
12 9 (1.81%) BusinessObjects
12 9 (1.81%) NoSQL
13 8 (1.61%) Amazon Redshift
13 8 (1.61%) MS Access
14 7 (1.41%) Data Lake
14 7 (1.41%) Hadoop
15 6 (1.21%) Oracle BI Publisher
Development Applications
1 41 (8.25%) JIRA
2 11 (2.21%) Git
3 6 (1.21%) Oracle Forms
4 5 (1.01%) ERwin
4 5 (1.01%) GitLab
5 4 (0.80%) MagicDraw
6 3 (0.60%) Jenkins
6 3 (0.60%) Visual Studio
7 2 (0.40%) Ant
7 2 (0.40%) XMLSpy
8 1 (0.20%) Bitbucket
8 1 (0.20%) Bitbucket Server
8 1 (0.20%) Jaeger
8 1 (0.20%) JUnit
8 1 (0.20%) MLflow
8 1 (0.20%) Selenium
8 1 (0.20%) SonarQube
8 1 (0.20%) Terragrunt
General
1 188 (37.83%) Social Skills
2 186 (37.42%) Finance
3 160 (32.19%) Analytical Skills
4 82 (16.50%) Banking
5 33 (6.64%) Presentation Skills
6 31 (6.24%) Front Office
7 30 (6.04%) Marketing
8 27 (5.43%) Public Sector
9 26 (5.23%) Investment Banking
10 19 (3.82%) Organisational Skills
11 17 (3.42%) Retail
12 14 (2.82%) Local Government
13 12 (2.41%) Legal
14 11 (2.21%) Inclusion and Diversity
15 9 (1.81%) Financial Institution
16 8 (1.61%) Influencing Skills
17 7 (1.41%) Corporate Banking
17 7 (1.41%) Documentation Skills
17 7 (1.41%) Telecoms
18 5 (1.01%) Military
Job Titles
1 254 (51.11%) Analyst
2 110 (22.13%) Business Analyst
3 107 (21.53%) Data Analyst
4 63 (12.68%) Developer
5 29 (5.84%) Senior
6 25 (5.03%) Lead
7 23 (4.63%) Consultant
8 22 (4.43%) Data Business Analyst
9 21 (4.23%) Senior Analyst
10 20 (4.02%) Data Engineer
11 19 (3.82%) Data Scientist
12 18 (3.62%) C# Developer
13 15 (3.02%) Architect
14 13 (2.62%) C# WPF Developer
14 13 (2.62%) WPF Developer
15 12 (2.41%) C# WCF Developer
15 12 (2.41%) Financial Analyst
15 12 (2.41%) WCF Developer
16 11 (2.21%) Automation Developer
16 11 (2.21%) Technical Analyst
Libraries, Frameworks & Software Standards
1 36 (7.24%) .NET
2 17 (3.42%) .NET Framework
2 17 (3.42%) WPF
3 13 (2.62%) WinForms
4 12 (2.41%) Pandas
4 12 (2.41%) WCF
5 11 (2.21%) REST
6 9 (1.81%) SOAP
7 8 (1.61%) Oracle Fusion
7 8 (1.61%) Web Services
7 8 (1.61%) XML
8 6 (1.21%) JSON
8 6 (1.21%) Kafka
9 5 (1.01%) PySpark
9 5 (1.01%) scikit-learn
10 3 (0.60%) AngularJS
10 3 (0.60%) Elastic Stack
10 3 (0.60%) FIX Protocol
10 3 (0.60%) NumPy
10 3 (0.60%) TensorFlow
Miscellaneous
1 18 (3.62%) Data Structures
1 18 (3.62%) Product Ownership
2 15 (3.02%) Management Information System
3 14 (2.82%) Algorithms
4 12 (2.41%) Analytical Mindset
5 11 (2.21%) Equities
6 10 (2.01%) Derivative
6 10 (2.01%) Foreign Exchange (FX)
7 9 (1.81%) Data Protection Act
7 9 (1.81%) Legacy Systems
7 9 (1.81%) Reference Data
7 9 (1.81%) Self-Motivation
7 9 (1.81%) Social Media
8 8 (1.61%) IoT
9 7 (1.41%) Market Risk
9 7 (1.41%) Multi-touch
9 7 (1.41%) Reinsurance
9 7 (1.41%) Virtual Team
10 5 (1.01%) Onboarding
10 5 (1.01%) SWIFT Messaging Network
Operating Systems
1 22 (4.43%) Windows
2 9 (1.81%) Linux
3 4 (0.80%) Unix
4 1 (0.20%) SUSE
Processes & Methodologies
1 125 (25.15%) Problem-Solving
2 117 (23.54%) Business Intelligence
3 98 (19.72%) Decision-Making
4 95 (19.11%) Visualisation
5 91 (18.31%) Analytics
6 88 (17.71%) Agile
7 77 (15.49%) Data Modelling
8 75 (15.09%) Stakeholder Management
9 73 (14.69%) Project Management
10 64 (12.88%) Business Analysis
11 56 (11.27%) Actionable Insight
12 53 (10.66%) Risk Management
13 52 (10.46%) Validation
14 50 (10.06%) Requirements Gathering
15 49 (9.86%) Data Visualisation
16 43 (8.65%) Process Improvement
17 42 (8.45%) Machine Learning
18 41 (8.25%) Change Management
19 39 (7.85%) Data Governance
20 38 (7.65%) User Acceptance Testing
Programming Languages
1 251 (50.50%) SQL
2 124 (24.95%) Python
3 43 (8.65%) C#
4 31 (6.24%) VBA
5 30 (6.04%) R
6 22 (4.43%) PL/SQL
6 22 (4.43%) T-SQL
7 16 (3.22%) JavaScript
8 12 (2.41%) VB
9 11 (2.21%) PowerShell
10 10 (2.01%) Data Analysis Expressions
10 10 (2.01%) Java
11 7 (1.41%) C++
12 3 (0.60%) MATLAB
12 3 (0.60%) PHP
12 3 (0.60%) Scala
12 3 (0.60%) Shell Script
13 2 (0.40%) Bash
13 2 (0.40%) C
13 2 (0.40%) TypeScript
Qualifications
1 83 (16.70%) Degree
2 43 (8.65%) Security Cleared
3 40 (8.05%) SC Cleared
4 19 (3.82%) Master's Degree
5 15 (3.02%) Computer Science Degree
6 7 (1.41%) CBAP
6 7 (1.41%) PhD
7 5 (1.01%) PMI Certification
8 4 (0.80%) Microsoft Certification
8 4 (0.80%) Numerate Degree
8 4 (0.80%) PMP
9 3 (0.60%) CFA
9 3 (0.60%) DV Cleared
9 3 (0.60%) HNC
9 3 (0.60%) IIBA
10 2 (0.40%) ACCA
10 2 (0.40%) CCAB
10 2 (0.40%) CIMA
10 2 (0.40%) PRINCE2 Certification
10 2 (0.40%) SAP Certification
Quality Assurance & Compliance
1 54 (10.87%) Data Quality
2 38 (7.65%) QA
3 18 (3.62%) MiFID
4 15 (3.02%) EMIR
4 15 (3.02%) GDPR
5 13 (2.62%) Accessibility
6 9 (1.81%) PMO
7 8 (1.61%) Actionable Recommendations
8 5 (1.01%) Dodd-Frank
8 5 (1.01%) ISO/IEC 27001
9 4 (0.80%) Basel III
10 3 (0.60%) Sarbanes-Oxley
10 3 (0.60%) SLA
11 2 (0.40%) Disclosure Scotland
12 1 (0.20%) GRC
12 1 (0.20%) IFRS
12 1 (0.20%) NIST
12 1 (0.20%) PCI DSS
12 1 (0.20%) SOC 2
12 1 (0.20%) Solvency II
System Software
1 3 (0.60%) FreeRADIUS
1 3 (0.60%) iptables
2 2 (0.40%) Active Directory
2 2 (0.40%) Docker
3 1 (0.20%) Virtual Machines
Systems Management
1 8 (1.61%) Terraform
2 5 (1.01%) Ansible
3 4 (0.80%) Grafana
4 3 (0.60%) Cacti
4 3 (0.60%) Nagios
4 3 (0.60%) Netcool
4 3 (0.60%) Proxmox
4 3 (0.60%) Puppet
4 3 (0.60%) ZABBIX
5 2 (0.40%) Prometheus
6 1 (0.20%) Graylog
6 1 (0.20%) Kubeflow
6 1 (0.20%) Kubernetes
6 1 (0.20%) logstash
6 1 (0.20%) Rancher
6 1 (0.20%) Single Sign-On
Vendors
1 78 (15.69%) Microsoft
2 54 (10.87%) Oracle
3 26 (5.23%) Google
4 20 (4.02%) SAP
5 14 (2.82%) Citrix
6 9 (1.81%) Databricks
7 8 (1.61%) Alteryx
7 8 (1.61%) ServiceNow
8 7 (1.41%) Salesforce
8 7 (1.41%) UiPath
8 7 (1.41%) Workday
9 5 (1.01%) Foundry
10 4 (0.80%) Adobe
10 4 (0.80%) Charles River
10 4 (0.80%) Splunk
11 3 (0.60%) Ariba
11 3 (0.60%) Bloomberg
11 3 (0.60%) Informatica
11 3 (0.60%) Murex
11 3 (0.60%) Nokia