Salesforce Jobs in London

Salesforce
England > London

The table below provides summary statistics for permanent job vacancies advertised in London with a requirement for knowledge and experience of Salesforce products and/or services. Included is a benchmarking guide to the salaries offered in vacancies that have cited Salesforce over the 6 months to 11 May 2024 with a comparison to the same period in the previous 2 years.

The figures below represent the IT labour market in general and are not representative of salaries within Salesforce.

6 months to
11 May 2024
Same period 2023 Same period 2022
Rank 178 129 175
Rank change year-on-year -49 +46 -35
Permanent jobs citing Salesforce 444 971 1,683
As % of all permanent jobs advertised in London 1.88% 2.83% 2.49%
As % of the Vendors category 4.63% 7.18% 6.63%
Number of salaries quoted 372 710 840
10th Percentile - £42,500 £41,250
25th Percentile £40,000 £50,250 £51,250
Median annual salary (50th Percentile) £62,500 £70,000 £70,000
Median % change year-on-year -10.71% - +3.70%
75th Percentile £83,750 £85,000 £87,500
90th Percentile £97,500 £96,250 £100,000
England median annual salary £47,500 £60,899 £62,500
% change year-on-year -22.00% -2.56% +4.17%

All Vendors
London

Salesforce is in the Vendor Products and Services category. The following table is for comparison with the above and provides summary statistics for all permanent job vacancies with a requirement for knowledge or experience of vendor products and services advertised in London.

Permanent vacancies with a requirement for knowledge or experience of vendor products and services 9,597 13,527 25,401
As % of all permanent jobs advertised in London 40.60% 39.48% 37.61%
Number of salaries quoted 6,582 9,363 12,650
10th Percentile £35,500 £37,500 £36,750
25th Percentile £47,500 £50,749 £50,000
Median annual salary (50th Percentile) £65,000 £67,500 £65,000
Median % change year-on-year -3.70% +3.85% -
75th Percentile £87,500 £87,500 £85,000
90th Percentile £105,000 £105,000 £102,500
England median annual salary £50,000 £57,413 £55,000
% change year-on-year -12.91% +4.39% +4.43%

Salesforce
Job Vacancy Trend in London

Job postings citing Salesforce as a proportion of all IT jobs advertised in London.
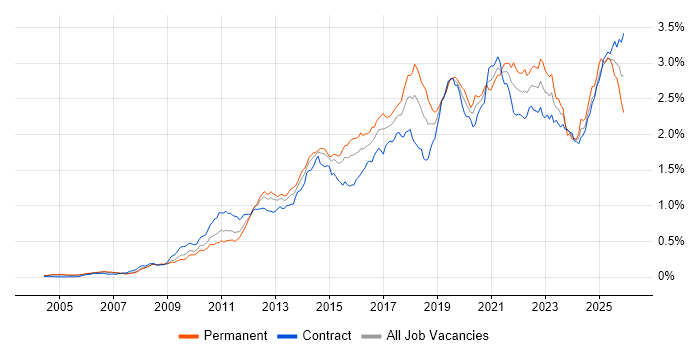
Job vacancy trend for Salesforce in London

Salesforce
Salary Trend in London

3-month moving average salary quoted in jobs citing Salesforce in London.

Salary trend for Salesforce in London

Salesforce
Salary Histogram in London

Salary distribution for jobs citing Salesforce in London over the 6 months to 11 May 2024.

Salary histogram for Salesforce in London

Salesforce
Job Locations in London

The table below looks at the demand and provides a guide to the median salaries quoted in IT jobs citing Salesforce within the London region over the 6 months to 11 May 2024. The 'Rank Change' column provides an indication of the change in demand within each location based on the same 6 month period last year.

Location Rank Change
on Same Period
Last Year
Matching
Permanent
IT Job Ads
Median Salary
Past 6 Months
Median Salary
% Change
on Same Period
Last Year
Live
Jobs
Central London +39 99 £60,250 -24.69% 18
West London -19 37 £40,000 -17.84% 8
South London -4 16 £40,000 -17.84% 4
East London +23 9 £40,000 -46.67% 5
Salesforce
England

Salesforce
Co-occurring Skills and Capabilities in London by Category

The follow tables expand on the table above by listing co-occurrences grouped by category. The same employment type, locality and period is covered with up to 20 co-occurrences shown in each of the following categories:

Application Platforms
1 11 (2.48%) Confluence
2 6 (1.35%) CMS
2 6 (1.35%) Oracle Workflow
2 6 (1.35%) SharePoint
3 5 (1.13%) Drupal
4 4 (0.90%) WordPress
5 2 (0.45%) Anypoint
5 2 (0.45%) ArcGIS
5 2 (0.45%) Microsoft Exchange
Applications
1 18 (4.05%) Microsoft Office
2 15 (3.38%) Microsoft Excel
3 7 (1.58%) Spreadsheet
4 4 (0.90%) InDesign
4 4 (0.90%) Microsoft PowerPoint
4 4 (0.90%) Photoshop
5 3 (0.68%) Microsoft Project
6 2 (0.45%) MS Visio
7 1 (0.23%) Adobe Creative Suite
7 1 (0.23%) Chatbot
Business Applications
1 24 (5.41%) Salesforce CRM
2 7 (1.58%) Dynamics CRM
3 4 (0.90%) Eloqua
3 4 (0.90%) NetSuite
4 3 (0.68%) Payment Gateway
4 3 (0.68%) Raiser’s Edge
4 3 (0.68%) SAP CX
4 3 (0.68%) SAP SD
5 2 (0.45%) Oracle EBS
5 2 (0.45%) SAP CRM
5 2 (0.45%) SAP ERP
5 2 (0.45%) SAP S/4HANA
5 2 (0.45%) Sparx Enterprise Architect
5 2 (0.45%) Summit
6 1 (0.23%) Dynamics NAV
6 1 (0.23%) Magento
6 1 (0.23%) SAP VC
6 1 (0.23%) Workday HCM
Cloud Services
1 53 (11.94%) Azure
2 48 (10.81%) SaaS
3 28 (6.31%) AWS
4 23 (5.18%) Salesforce Service Cloud
5 21 (4.73%) PaaS
6 20 (4.50%) IaaS
7 19 (4.28%) Salesforce Sales Cloud
8 13 (2.93%) Power Platform
9 12 (2.70%) Microsoft 365
10 11 (2.48%) FinancialForce
11 9 (2.03%) Boomi
11 9 (2.03%) Google Analytics
12 7 (1.58%) Google Workspace
12 7 (1.58%) Salesforce Commerce Cloud
13 6 (1.35%) Asana
13 6 (1.35%) Figma
13 6 (1.35%) Snowflake
14 4 (0.90%) Canva
14 4 (0.90%) Dynamics 365
14 4 (0.90%) GitHub
Communications & Networking
1 4 (0.90%) VoIP
2 2 (0.45%) Broadband
3 1 (0.23%) HTTP
3 1 (0.23%) LTE
Database & Business Intelligence
1 14 (3.15%) Data Warehouse
2 13 (2.93%) Power BI
2 13 (2.93%) Tableau
3 10 (2.25%) SQL Server
4 5 (1.13%) Relational Database
4 5 (1.13%) SQL Server Integration Services
5 4 (0.90%) DBAmp
6 3 (0.68%) Azure SQL Database
6 3 (0.68%) Looker
6 3 (0.68%) Metadata
6 3 (0.68%) SAP BW
7 2 (0.45%) GIS
7 2 (0.45%) PostgreSQL
7 2 (0.45%) SAP HANA
8 1 (0.23%) Big Data
8 1 (0.23%) BigQuery
8 1 (0.23%) DynamoDB
8 1 (0.23%) MongoDB
8 1 (0.23%) SAP Data Services
8 1 (0.23%) SQL Server Reporting Services
Development Applications
1 27 (6.08%) JIRA
2 10 (2.25%) Oracle APEX
3 7 (1.58%) Git
4 6 (1.35%) Eclipse
5 5 (1.13%) Jenkins
6 4 (0.90%) Ant
6 4 (0.90%) Bitbucket
6 4 (0.90%) Visual Studio
7 1 (0.23%) Atlassian Bamboo
7 1 (0.23%) Selenium
General
1 142 (31.98%) Social Skills
2 112 (25.23%) Finance
3 88 (19.82%) Marketing
4 62 (13.96%) Analytical Skills
5 33 (7.43%) Inclusion and Diversity
6 30 (6.76%) Retail
7 21 (4.73%) Presentation Skills
8 18 (4.05%) Banking
9 15 (3.38%) Legal
10 14 (3.15%) Public Sector
11 6 (1.35%) German Language
12 5 (1.13%) Health Technology
13 4 (0.90%) Back Office
13 4 (0.90%) Financial Institution
13 4 (0.90%) Influencing Skills
14 3 (0.68%) Advertising
14 3 (0.68%) Brand Awareness
14 3 (0.68%) Organisational Skills
15 2 (0.45%) Social Science
15 2 (0.45%) Telecoms
Job Titles
1 88 (19.82%) Business Manager
2 85 (19.14%) Business Development Manager
2 85 (19.14%) Development Manager
3 76 (17.12%) Developer
4 66 (14.86%) Salesforce Developer
5 58 (13.06%) Architect
6 56 (12.61%) Senior
7 41 (9.23%) Salesforce Architect
8 38 (8.56%) Analyst
9 36 (8.11%) Solutions Architect
10 31 (6.98%) Consultant
10 31 (6.98%) Lead
11 30 (6.76%) Salesforce Solution Architect
12 19 (4.28%) Senior Developer
13 18 (4.05%) Business Analyst
14 17 (3.83%) Senior Salesforce Developer
15 16 (3.60%) Senior Manager
16 15 (3.38%) Project Manager
17 14 (3.15%) Salesforce Analyst
17 14 (3.15%) Technical Manager
Libraries, Frameworks & Software Standards
1 41 (9.23%) Lightning Web Components
2 30 (6.76%) Middleware
3 29 (6.53%) Visualforce
4 25 (5.63%) SOAP
5 22 (4.95%) .NET
6 21 (4.73%) REST
7 18 (4.05%) HTML
8 15 (3.38%) ASP.NET
9 12 (2.70%) Web Services
10 11 (2.48%) ASP.NET MVC
10 11 (2.48%) XML
11 9 (2.03%) CSS
11 9 (2.03%) OAuth
12 8 (1.80%) RESTful
13 6 (1.35%) .NET Core
13 6 (1.35%) .NET Framework
13 6 (1.35%) Ajax
13 6 (1.35%) XHTML
14 5 (1.13%) HTML5
14 5 (1.13%) JSON
Miscellaneous
1 18 (4.05%) Enterprise Software
1 18 (4.05%) Public Cloud
1 18 (4.05%) Social Media
2 12 (2.70%) Data Structures
2 12 (2.70%) Management Information System
2 12 (2.70%) Product Ownership
3 11 (2.48%) Marketing Technology
4 9 (2.03%) Virtual Team
5 8 (1.80%) Greenfield Project
5 8 (1.80%) Reinsurance
6 6 (1.35%) Mobile Payment
7 5 (1.13%) Graphic Design
7 5 (1.13%) Onboarding
7 5 (1.13%) Self-Motivation
8 4 (0.90%) Blog
8 4 (0.90%) Housing Association
8 4 (0.90%) Hybrid Cloud
8 4 (0.90%) Legacy Applications
9 3 (0.68%) Algorithms
9 3 (0.68%) Life Science
Operating Systems
1 9 (2.03%) Windows
2 5 (1.13%) Mac OS
3 4 (0.90%) Mac OS X
4 1 (0.23%) Android
4 1 (0.23%) Apple iOS
4 1 (0.23%) Windows Vista
Processes & Methodologies
1 111 (25.00%) CRM
2 106 (23.87%) Customer Experience
3 99 (22.30%) Business Development
4 93 (20.95%) Agile
5 86 (19.37%) Problem-Solving
6 76 (17.12%) Client Onboarding
7 48 (10.81%) Business Strategy
8 43 (9.68%) Stakeholder Management
9 42 (9.46%) Analytics
10 36 (8.11%) Project Management
11 31 (6.98%) Roadmaps
12 29 (6.53%) Enterprise Architecture
13 27 (6.08%) Configure, Price, Quote (CPQ)
13 27 (6.08%) Migration
14 26 (5.86%) Decision-Making
15 25 (5.63%) Mentoring
15 25 (5.63%) Strategic Thinking
16 24 (5.41%) Requirements Gathering
17 23 (5.18%) Artificial Intelligence
17 23 (5.18%) SOA
Programming Languages
1 54 (12.16%) Apex Code
2 47 (10.59%) SQL
3 21 (4.73%) JavaScript
4 18 (4.05%) Python
5 14 (3.15%) C#
6 11 (2.48%) R
6 11 (2.48%) SOQL
7 8 (1.80%) Java
8 4 (0.90%) Bash
9 3 (0.68%) TypeScript
10 1 (0.23%) ABAP
10 1 (0.23%) C
10 1 (0.23%) Data Analysis Expressions
10 1 (0.23%) Scala
10 1 (0.23%) T-SQL
10 1 (0.23%) VB
Qualifications
1 70 (15.77%) Degree
2 19 (4.28%) TOGAF Certification
3 5 (1.13%) Computer Science Degree
3 5 (1.13%) DBS Check
4 4 (0.90%) PMI Certification
5 3 (0.68%) Azure Certification
5 3 (0.68%) BPSS Clearance
5 3 (0.68%) Master's Degree
6 2 (0.45%) MBA
6 2 (0.45%) Microsoft Certification
6 2 (0.45%) PMP
6 2 (0.45%) Security Cleared
7 1 (0.23%) CISSP
7 1 (0.23%) CSSLP
7 1 (0.23%) ITIL Certification
Quality Assurance & Compliance
1 9 (2.03%) QA
2 6 (1.35%) SLA
3 5 (1.13%) Data Quality
4 4 (0.90%) Accessibility
4 4 (0.90%) GDPR
5 2 (0.45%) IFRS
5 2 (0.45%) ISO/IEC 27001
5 2 (0.45%) PMBOK
6 1 (0.23%) COBIT
6 1 (0.23%) PMO
Systems Management
1 9 (2.03%) Single Sign-On
2 6 (1.35%) CloudHub
3 4 (0.90%) Jamf Pro
4 2 (0.45%) Microsoft Intune
Vendors
1 40 (9.01%) Microsoft
2 24 (5.41%) MuleSoft
2 24 (5.41%) SAP
3 21 (4.73%) Oracle
4 19 (4.28%) Salesforce Marketing Cloud
5 15 (3.38%) Google
6 13 (2.93%) Pardot
7 10 (2.25%) Adobe
7 10 (2.25%) Marketo
8 8 (1.80%) Atlassian
8 8 (1.80%) Zuora
9 7 (1.58%) F5
10 6 (1.35%) DocuSign
10 6 (1.35%) Sybase
11 5 (1.13%) IBM
11 5 (1.13%) Iron Mountain
11 5 (1.13%) Pega
12 4 (0.90%) Alteryx
12 4 (0.90%) Apttus
12 4 (0.90%) ServiceNow