Apple Mac OS X
UK

The following table provides summary statistics for permanent job vacancies with a requirement for Mac OS X skills. Included is a benchmarking guide to the salaries offered in vacancies that have cited Mac OS X over the 6 months to 29 November 2023 with a comparison to the same period in the previous 2 years.

6 months to
29 Nov 2023
Same period 2022 Same period 2021
Rank 662 932 846
Rank change year-on-year +270 -86 -193
Permanent jobs citing Mac OS X 71 158 254
As % of all permanent jobs advertised in the UK 0.13% 0.13% 0.20%
As % of the Operating Systems category 0.75% 0.75% 1.14%
Number of salaries quoted 59 102 218
10th Percentile £28,000 £25,913 £23,500
25th Percentile £30,500 £31,250 £28,063
Median annual salary (50th Percentile) £45,000 £37,500 £35,000
Median % change year-on-year +20.00% +7.14% -24.73%
75th Percentile £57,297 £43,625 £52,500
90th Percentile £60,000 £67,500 £70,000
UK excluding London median annual salary £31,125 £37,500 £28,500
% change year-on-year -17.00% +31.58% -3.39%

All Operating Systems
UK

Mac OS X is in the Operating Systems category. The following table is for comparison with the above and provides summary statistics for all permanent job vacancies with a requirement for operating system skills.

Permanent vacancies with a requirement for operating system skills 9,453 20,960 22,312
As % of all permanent jobs advertised in the UK 17.47% 16.66% 17.29%
Number of salaries quoted 7,313 13,974 16,018
10th Percentile £27,500 £27,500 £26,250
25th Percentile £35,000 £36,250 £35,000
Median annual salary (50th Percentile) £50,000 £52,500 £50,000
Median % change year-on-year -4.76% +5.00% -
75th Percentile £68,750 £72,500 £69,938
90th Percentile £87,500 £91,250 £85,000
UK excluding London median annual salary £45,000 £45,000 £45,000

Mac OS X
Job Vacancy Trend

Job postings citing Mac OS X as a proportion of all IT jobs advertised.
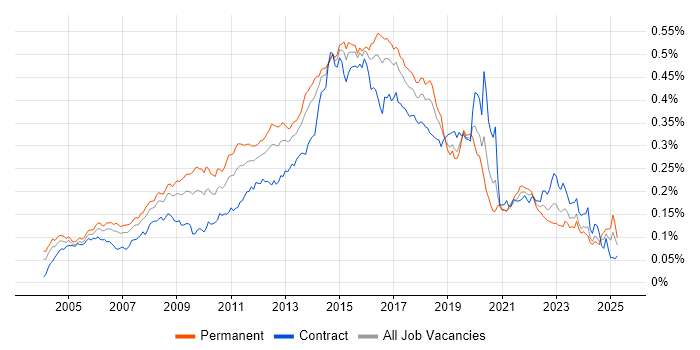
Job vacancy trend for Mac OS X in the UK

Mac OS X
Salary Trend

3-month moving average salary quoted in jobs citing Mac OS X.

Salary trend for Mac OS X in the UK

Mac OS X
Salary Histogram

Salary distribution for jobs citing Mac OS X over the 6 months to 29 November 2023.

Salary histogram for Mac OS X in the UK

Mac OS X
Top 12 Job Locations

The table below looks at the demand and provides a guide to the median salaries quoted in IT jobs citing Mac OS X within the UK over the 6 months to 29 November 2023. The 'Rank Change' column provides an indication of the change in demand within each location based on the same 6 month period last year.

Location Rank Change
on Same Period
Last Year
Matching
Permanent
IT Job Ads
Median Salary
Past 6 Months
Median Salary
% Change
on Same Period
Last Year
Live
Jobs
England +234 65 £45,000 +23.25% 33
London +232 40 £50,000 +39.86% 16
Work from Home +228 31 £53,300 +33.25% 5
UK excluding London +190 31 £31,125 -17.00% 19
South East +134 9 £29,000 -10.77% 7
East of England +114 9 £37,500 - 1
Scotland +61 6 £28,000 -27.74% 2
South West +65 3 £28,000 +6.67% 2
North of England +128 2 £41,500 +41.08% 3
Midlands +117 2 - - 5
North West +106 2 £41,500 +40.68% 2
West Midlands +104 2 - - 5

Mac OS X
Co-occurring Skills and Capabilities by Category

The follow tables expand on the table above by listing co-occurrences grouped by category. The same employment type, locality and period is covered with up to 20 co-occurrences shown in each of the following categories:

Application Platforms
1 13 (18.31%) MS Exchange
2 9 (12.68%) SharePoint
3 4 (5.63%) Confluence
4 3 (4.23%) Exchange Server 2010
4 3 (4.23%) IIS
5 2 (2.82%) Exchange Server 2013
5 2 (2.82%) Skype for Business
Applications
1 17 (23.94%) Microsoft Office
2 3 (4.23%) Microsoft Excel
2 3 (4.23%) Microsoft PowerPoint
3 1 (1.41%) InCopy
Business Applications
1 1 (1.41%) Magento
1 1 (1.41%) NetSuite
Cloud Services
1 48 (67.61%) Microsoft 365
2 23 (32.39%) Azure
3 21 (29.58%) AWS
4 11 (15.49%) Entra ID
5 5 (7.04%) Mimecast
6 4 (5.63%) Google Workspace
6 4 (5.63%) WhatsApp
7 3 (4.23%) Amazon EC2
7 3 (4.23%) OneDrive
8 1 (1.41%) Adobe Creative Cloud
8 1 (1.41%) Amazon S3
8 1 (1.41%) Azure Sentinel
8 1 (1.41%) Dropbox
8 1 (1.41%) GCP
8 1 (1.41%) Google Drive
8 1 (1.41%) PaaS
Communications & Networking
1 15 (21.13%) Firewall
2 11 (15.49%) TCP/IP
3 10 (14.08%) VLAN
4 9 (12.68%) VPN
5 8 (11.27%) DNS
6 7 (9.86%) DHCP
6 7 (9.86%) Network Security
7 5 (7.04%) Internet
8 4 (5.63%) Cisco IOS
8 4 (5.63%) NAS
8 4 (5.63%) PBX
8 4 (5.63%) SAN
8 4 (5.63%) Skype
8 4 (5.63%) VoIP
9 3 (4.23%) Broadband
9 3 (4.23%) Ethernet
9 3 (4.23%) IP Telephony
9 3 (4.23%) ISDN
9 3 (4.23%) PSTN
10 2 (2.82%) Intrusion Detection
Database & Business Intelligence
1 4 (5.63%) Amazon RDS
2 3 (4.23%) SQL Server
3 1 (1.41%) BigQuery
3 1 (1.41%) Geospatial Data
3 1 (1.41%) GIS
3 1 (1.41%) MySQL
3 1 (1.41%) QGIS
3 1 (1.41%) Tableau
Development Applications
1 5 (7.04%) JIRA
2 4 (5.63%) Git
2 4 (5.63%) Subversion
3 2 (2.82%) Burp Suite
3 2 (2.82%) SoapUI
4 1 (1.41%) Eclipse
4 1 (1.41%) MSI
4 1 (1.41%) Visual Studio
General
1 23 (32.39%) Social Skills
2 10 (14.08%) Analytical Skills
3 7 (9.86%) Finance
4 4 (5.63%) Telecoms
5 3 (4.23%) Aviation
5 3 (4.23%) Legal
5 3 (4.23%) Publishing
6 2 (2.82%) Aeronautics
6 2 (2.82%) Automotive
7 1 (1.41%) Billing
7 1 (1.41%) Documentation Skills
7 1 (1.41%) Law
7 1 (1.41%) Retail
Job Titles
1 19 (26.76%) Senior
2 15 (21.13%) 2nd Line Support
3 14 (19.72%) Analyst
3 14 (19.72%) Support Engineer
4 13 (18.31%) IT Engineer
5 12 (16.90%) Support Analyst
6 11 (15.49%) Senior IT Engineer
7 10 (14.08%) IT Support
8 9 (12.68%) IT Analyst
9 7 (9.86%) 2nd Line Engineer
9 7 (9.86%) Desktop Support
9 7 (9.86%) IT Support Analyst
10 6 (8.45%) 2nd Line Support Analyst
10 6 (8.45%) 2nd Line Support Engineer
10 6 (8.45%) Desktop Engineer
10 6 (8.45%) Desktop Support Engineer
11 5 (7.04%) IT Technician
12 4 (5.63%) 1st/2nd Line Support
12 4 (5.63%) Audio Visual Technician
12 4 (5.63%) Principal Engineer
Libraries, Frameworks & Software Standards
1 3 (4.23%) 802.1X
2 2 (2.82%) Web Services
3 1 (1.41%) Elastic Stack
3 1 (1.41%) FIDO
3 1 (1.41%) HTML
3 1 (1.41%) OAuth
3 1 (1.41%) POSIX
3 1 (1.41%) SAML
Miscellaneous
1 5 (7.04%) iPhone
2 4 (5.63%) Cloud Native
2 4 (5.63%) Enterprise Storage
2 4 (5.63%) Home Automation
2 4 (5.63%) Smartphone
3 3 (4.23%) Hybrid Cloud
3 3 (4.23%) iPad
3 3 (4.23%) Video Conferencing
4 2 (2.82%) Distributed Denial-of-Service
4 2 (2.82%) Embedded Systems
4 2 (2.82%) IoT
4 2 (2.82%) Mobile App
4 2 (2.82%) Operational Technology
4 2 (2.82%) Security Operations Centre
5 1 (1.41%) Analytical Mindset
5 1 (1.41%) Cyberattack
5 1 (1.41%) Data Centre
5 1 (1.41%) Onboarding
5 1 (1.41%) PKI
5 1 (1.41%) Security Posture
Operating Systems
1 61 (85.92%) Windows
2 34 (47.89%) Windows 10
3 33 (46.48%) Windows Server
4 19 (26.76%) Linux
4 19 (26.76%) Windows Server 2016
5 17 (23.94%) Windows Server 2019
6 13 (18.31%) Android
7 11 (15.49%) Mac OS
8 9 (12.68%) Windows Server 2012
9 7 (9.86%) Windows 7
10 5 (7.04%) Apple iOS
11 4 (5.63%) Windows Server 2008
12 3 (4.23%) Windows 8
13 1 (1.41%) FreeBSD
13 1 (1.41%) Windows XP
Processes & Methodologies
1 19 (26.76%) Cybersecurity
2 17 (23.94%) Computer Science
3 16 (22.54%) User Experience
4 15 (21.13%) ITIL
5 14 (19.72%) Problem-Solving
6 11 (15.49%) API Integration
6 11 (15.49%) Customer Service
6 11 (15.49%) Data Loss Prevention
7 7 (9.86%) Change Management
7 7 (9.86%) Software Engineering
8 5 (7.04%) Agile
8 5 (7.04%) Service Delivery
9 4 (5.63%) Analytics
9 4 (5.63%) Continuous Delivery
9 4 (5.63%) ITSM
9 4 (5.63%) Mobile Device Management
9 4 (5.63%) Multithreading
9 4 (5.63%) Penetration Testing
9 4 (5.63%) Root Cause Analysis
9 4 (5.63%) SDLC
Programming Languages
1 17 (23.94%) PowerShell
2 15 (21.13%) SQL
3 13 (18.31%) Bash
4 7 (9.86%) Python
5 3 (4.23%) C#
6 2 (2.82%) C++
6 2 (2.82%) Go
7 1 (1.41%) Java
7 1 (1.41%) JavaScript
7 1 (1.41%) Perl
Qualifications
1 19 (26.76%) Degree
2 17 (23.94%) Computer Science Degree
3 4 (5.63%) Master's Degree
4 3 (4.23%) CCNA
4 3 (4.23%) Cisco Certification
4 3 (4.23%) SC Cleared
4 3 (4.23%) Security Cleared
5 2 (2.82%) A+ Certification
5 2 (2.82%) CEH
5 2 (2.82%) CHECK Team Leader
5 2 (2.82%) CHECK Team Member
5 2 (2.82%) CISSP
5 2 (2.82%) CompTIA Security+
5 2 (2.82%) CREST Certified
5 2 (2.82%) MCP
5 2 (2.82%) Microsoft Certification
5 2 (2.82%) OSCP
5 2 (2.82%) SANS
6 1 (1.41%) ACSP
6 1 (1.41%) CCENT
Quality Assurance & Compliance
1 5 (7.04%) ISO/IEC 27001
2 2 (2.82%) NIST
2 2 (2.82%) SLA
3 1 (1.41%) Cyber Essentials
3 1 (1.41%) GDPR
System Software
1 33 (46.48%) Active Directory
2 23 (32.39%) VMware Infrastructure
3 18 (25.35%) Hyper-V
4 3 (4.23%) BitLocker
4 3 (4.23%) NFS
4 3 (4.23%) VMware ESXi
5 1 (1.41%) Virtual Desktop
5 1 (1.41%) Virtual Machines
Systems Management
1 13 (18.31%) Microsoft Intune
2 11 (15.49%) Terraform
3 7 (9.86%) Jamf Pro
3 7 (9.86%) SCCM
4 5 (7.04%) Kubernetes
5 4 (5.63%) Ansible
5 4 (5.63%) vRealize
5 4 (5.63%) vRealize Orchestrator
6 2 (2.82%) AirWatch
7 1 (1.41%) Single Sign-On
7 1 (1.41%) vCenter Server
Vendors
1 50 (70.42%) Microsoft
2 25 (35.21%) VMware
3 21 (29.58%) Apple
4 12 (16.90%) Cisco
5 11 (15.49%) LogicMonitor
5 11 (15.49%) Okta
6 7 (9.86%) Adobe
7 6 (8.45%) ServiceNow
8 4 (5.63%) Atlassian
8 4 (5.63%) Dell
8 4 (5.63%) Google
8 4 (5.63%) Meraki
8 4 (5.63%) Synology
9 3 (4.23%) Avaya
9 3 (4.23%) Samsung
9 3 (4.23%) Splunk
10 2 (2.82%) Citrix
10 2 (2.82%) HP
10 2 (2.82%) MobileIron
10 2 (2.82%) Veeam