Strategic Planning Jobs

Strategic Planning
UK

The table below provides summary statistics for permanent job vacancies requiring Strategic Planning skills. It includes a benchmarking guide to the annual salaries offered in vacancies that cited Strategic Planning over the 6 months leading up to 18 July 2025, comparing them to the same period in the previous two years.

6 months to
18 Jul 2025
Same period 2024 Same period 2023
Rank 356 439 627
Rank change year-on-year +83 +188 +87
Permanent jobs citing Strategic Planning 434 552 276
As % of all permanent jobs advertised in the UK 0.72% 0.55% 0.33%
As % of the Processes & Methodologies category 0.81% 0.67% 0.34%
Number of salaries quoted 276 286 203
10th Percentile £45,000 £34,125 £30,754
25th Percentile £60,569 £46,250 £35,500
Median annual salary (50th Percentile) £70,000 £56,000 £47,646
Median % change year-on-year +25.00% +17.53% -21.60%
75th Percentile £90,000 £73,750 £75,000
90th Percentile £116,250 £94,375 £90,000
UK excluding London median annual salary £70,000 £56,000 £39,000
% change year-on-year +25.00% +43.59% -31.67%

All Process and Methodology Skills
UK

Strategic Planning falls under the Processes and Methodologies category. For comparison with the information above, the following table provides summary statistics for all permanent job vacancies requiring process or methodology skills.

Permanent vacancies with a requirement for process or methodology skills 53,902 82,463 80,523
As % of all permanent jobs advertised in the UK 89.66% 82.47% 95.46%
Number of salaries quoted 28,448 55,808 51,725
10th Percentile £27,500 £30,000 £33,750
25th Percentile £38,000 £40,000 £45,000
Median annual salary (50th Percentile) £55,000 £55,000 £60,249
Median % change year-on-year - -8.71% +0.42%
75th Percentile £75,000 £72,500 £80,000
90th Percentile £95,000 £92,500 £100,000
UK excluding London median annual salary £50,000 £50,000 £55,000
% change year-on-year - -9.09% +4.76%

Strategic Planning
Job Vacancy Trend

Job postings citing Strategic Planning as a proportion of all IT jobs advertised.
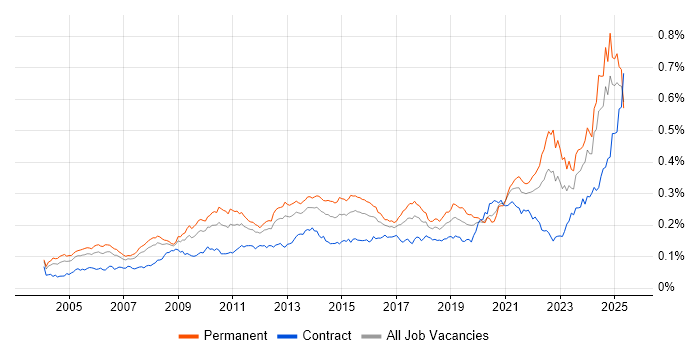
Job vacancy trend for Strategic Planning in the UK

Strategic Planning
Salary Trend

3-month moving average salary quoted in jobs citing Strategic Planning.

Salary trend for Strategic Planning in the UK

Strategic Planning
Salary Histogram

Salary distribution for jobs citing Strategic Planning over the 6 months to 18 July 2025.

Salary histogram for Strategic Planning in the UK

Strategic Planning
Top 17 Job Locations

The table below looks at the demand and provides a guide to the median salaries quoted in IT jobs citing Strategic Planning within the UK over the 6 months to 18 July 2025. The 'Rank Change' column provides an indication of the change in demand within each location based on the same 6 month period last year.

Location Rank Change
on Same Period
Last Year
Matching
Permanent
IT Job Ads
Median Salary
Past 6 Months
Median Salary
% Change
on Same Period
Last Year
Live
Jobs
England +44 381 £70,000 +23.88% 642
UK excluding London +45 249 £70,000 +25.00% 324
London +102 163 £70,000 +21.74% 365
Work from Home +112 136 £73,750 +39.38% 325
South East +69 85 £70,000 +33.33% 89
North of England +6 62 £62,500 +10.60% 99
Midlands -31 29 £70,000 +7.69% 47
North West -42 28 £53,643 -5.07% 60
Yorkshire +57 27 £80,000 +48.84% 30
South West +93 26 £95,000 +45.04% 27
Scotland +102 23 £83,738 +88.45% 19
West Midlands +14 23 £65,000 -13.33% 30
East of England +4 10 £83,738 +51.81% 28
Wales +38 8 £70,000 -11.70% 12
North East +37 7 - - 9
Northern Ireland +42 6 - - 9
East Midlands -21 6 £70,000 +16.67% 16

Strategic Planning
Co-occurring Skills and Capabilities by Category

The follow tables expand on the table above by listing co-occurrences grouped by category. The same employment type, locality and period is covered with up to 20 co-occurrences shown in each of the following categories:

Application Platforms
1 22 (5.07%) SharePoint
2 9 (2.07%) Moodle
3 6 (1.38%) Microsoft Exchange
4 4 (0.92%) IIS
5 2 (0.46%) ArcGIS
6 1 (0.23%) CICS
6 1 (0.23%) CMS
6 1 (0.23%) Confluence
6 1 (0.23%) SharePoint Server
6 1 (0.23%) WordPress
Applications
1 26 (5.99%) Microsoft Excel
2 15 (3.46%) Microsoft Office
3 12 (2.76%) Microsoft PowerPoint
4 7 (1.61%) Microsoft Project
5 6 (1.38%) AutoCAD
6 2 (0.46%) Adobe Creative Suite
6 2 (0.46%) Adobe Illustrator
6 2 (0.46%) MS Visio
6 2 (0.46%) Spreadsheet
Business Applications
1 11 (2.53%) Remedy ITSM
2 7 (1.61%) Adaptiv
3 3 (0.69%) Primavera
4 2 (0.46%) Dynamics CRM
4 2 (0.46%) NetSuite
4 2 (0.46%) Workday HCM
5 1 (0.23%) Oracle ERP
Cloud Services
1 50 (11.52%) Power Platform
2 47 (10.83%) Azure
3 30 (6.91%) Microsoft 365
4 24 (5.53%) Entra ID
4 24 (5.53%) SaaS
5 22 (5.07%) AWS
6 8 (1.84%) Microsoft Purview
6 8 (1.84%) PowerApps
7 7 (1.61%) GitHub
8 6 (1.38%) GCP
9 5 (1.15%) Power Automate
10 4 (0.92%) Amazon EC2
10 4 (0.92%) Amazon ECS
10 4 (0.92%) Amazon EMR
10 4 (0.92%) Amazon MSK
10 4 (0.92%) Amazon S3
10 4 (0.92%) AWS Lambda
10 4 (0.92%) Azure Synapse Analytics
10 4 (0.92%) Dynamics 365
10 4 (0.92%) Serverless
Communications & Networking
1 29 (6.68%) WAN
2 25 (5.76%) Firewall
3 21 (4.84%) LAN
4 15 (3.46%) VLAN
5 12 (2.76%) DNS
5 12 (2.76%) Wi-Fi
6 10 (2.30%) VPN
7 9 (2.07%) SD-WAN
8 7 (1.61%) DHCP
8 7 (1.61%) TCP/IP
9 6 (1.38%) Network Security
10 4 (0.92%) BGP
10 4 (0.92%) Internet
10 4 (0.92%) OSPF
10 4 (0.92%) VoIP
11 3 (0.69%) Wireless
12 2 (0.46%) SAN
12 2 (0.46%) Unified Communications
13 1 (0.23%) Fibre Channel
13 1 (0.23%) NAS
Database & Business Intelligence
1 40 (9.22%) Power BI
2 16 (3.69%) Tableau
3 14 (3.23%) SQL Server
4 9 (2.07%) Electronic Patient Records
5 4 (0.92%) Amazon Athena
5 4 (0.92%) Amazon RDS
5 4 (0.92%) Data Warehouse
5 4 (0.92%) Metadata
5 4 (0.92%) Power Query
6 3 (0.69%) Metadata Repository
6 3 (0.69%) PostgreSQL
6 3 (0.69%) Spark SQL
7 2 (0.46%) Amazon QuickSight
7 2 (0.46%) DTS
8 1 (0.23%) DB2
8 1 (0.23%) Enterprise Data Warehouse
8 1 (0.23%) GIS
8 1 (0.23%) KDB
8 1 (0.23%) Looker
Development Applications
1 17 (3.92%) JIRA
2 9 (2.07%) Git
2 9 (2.07%) Jenkins
3 8 (1.84%) Maven
4 7 (1.61%) GitLab
5 4 (0.92%) Subversion
6 1 (0.23%) ERwin
6 1 (0.23%) MSI
General
1 205 (47.24%) Finance
1 205 (47.24%) Social Skills
2 114 (26.27%) Analytical Skills
3 88 (20.28%) Marketing
4 67 (15.44%) Inclusion and Diversity
4 67 (15.44%) Public Sector
5 38 (8.76%) Influencing Skills
6 37 (8.53%) Manufacturing
7 29 (6.68%) Electronics
8 28 (6.45%) Law
9 27 (6.22%) Banking
9 27 (6.22%) Local Government
9 27 (6.22%) Telecoms
10 19 (4.38%) Legal
11 16 (3.69%) Presentation Skills
11 16 (3.69%) Retail
12 13 (3.00%) Advertising
13 7 (1.61%) Pharmaceutical
14 6 (1.38%) Organisational Skills
15 4 (0.92%) Documentation Skills
Job Titles
1 65 (14.98%) Lead
2 50 (11.52%) IT Manager
3 42 (9.68%) Senior
4 37 (8.53%) Analyst
5 29 (6.68%) IT Support
5 29 (6.68%) Operations Manager
6 28 (6.45%) Architect
6 28 (6.45%) IT Operations Manager
6 28 (6.45%) IT Support Manager
6 28 (6.45%) Support Manager
7 23 (5.30%) Civil Engineer
7 23 (5.30%) Development Engineer
7 23 (5.30%) Infrastructure Engineer
7 23 (5.30%) Project Manager
8 22 (5.07%) Head of IT
9 17 (3.92%) Delivery Manager
9 17 (3.92%) Principal Engineer
9 17 (3.92%) Software Engineer
10 16 (3.69%) Data Analytics Director
10 16 (3.69%) Network Manager
Libraries, Frameworks & Software Standards
1 10 (2.30%) .NET
1 10 (2.30%) React
2 8 (1.84%) Middleware
2 8 (1.84%) OAuth
2 8 (1.84%) OAuth2
2 8 (1.84%) OpenID
2 8 (1.84%) SailPoint
2 8 (1.84%) SAML
2 8 (1.84%) Spring
3 7 (1.61%) Spring Boot
3 7 (1.61%) YAML
4 5 (1.15%) Lightning Web Components
4 5 (1.15%) Software Packaging
5 4 (0.92%) AngularJS
5 4 (0.92%) Hibernate
5 4 (0.92%) HTML
5 4 (0.92%) jQuery
5 4 (0.92%) Kafka
5 4 (0.92%) REST
5 4 (0.92%) WebSockets
Miscellaneous
1 37 (8.53%) NHS
2 26 (5.99%) Management Information System
3 21 (4.84%) Data Centre
4 20 (4.61%) FMCG
5 16 (3.69%) Hybrid Cloud
5 16 (3.69%) Product Ownership
6 15 (3.46%) Renewable Energy
7 12 (2.76%) Self-Motivation
8 11 (2.53%) Fibre Optics
9 10 (2.30%) Onboarding
10 9 (2.07%) Learning Management System
10 9 (2.07%) Market Risk
10 9 (2.07%) SCADA
10 9 (2.07%) Virtual Team
11 8 (1.84%) Analytical Mindset
12 7 (1.61%) Credit Risk
12 7 (1.61%) Digital Media
12 7 (1.61%) Distributed Systems
13 5 (1.15%) Data Structures
13 5 (1.15%) PACS
Operating Systems
1 19 (4.38%) Windows
2 5 (1.15%) Linux
2 5 (1.15%) Windows Server
3 2 (0.46%) Android
3 2 (0.46%) Apple iOS
3 2 (0.46%) Unix
4 1 (0.23%) Ubuntu
4 1 (0.23%) zOS
Processes & Methodologies
1 148 (34.10%) Project Management
2 105 (24.19%) Problem-Solving
3 103 (23.73%) Decision-Making
4 101 (23.27%) Continuous Improvement
5 94 (21.66%) Roadmaps
6 88 (20.28%) Project Delivery
7 78 (17.97%) ITIL
8 75 (17.28%) Business Intelligence
9 74 (17.05%) Business Strategy
10 73 (16.82%) Agile
11 67 (15.44%) Analytics
12 63 (14.52%) Mentoring
12 63 (14.52%) Service Delivery
13 59 (13.59%) Stakeholder Management
14 54 (12.44%) Business Development
15 52 (11.98%) Stakeholder Engagement
16 48 (11.06%) Artificial Intelligence
16 48 (11.06%) Service Management
17 47 (10.83%) ITSM
17 47 (10.83%) Risk Management
Programming Languages
1 35 (8.06%) SQL
2 30 (6.91%) Python
3 21 (4.84%) Java
4 11 (2.53%) PowerShell
5 8 (1.84%) C#
5 8 (1.84%) JavaScript
6 6 (1.38%) TypeScript
7 3 (0.69%) RPG
8 2 (0.46%) VB.NET
9 1 (0.23%) Assembly Language
9 1 (0.23%) COBOL
9 1 (0.23%) Data Analysis Expressions
9 1 (0.23%) REXX
9 1 (0.23%) VBScript
Qualifications
1 131 (30.18%) Degree
2 53 (12.21%) PMI Certification
2 53 (12.21%) PMP
3 36 (8.29%) CISSP
4 28 (6.45%) Computer Science Degree
5 22 (5.07%) BPSS Clearance
6 20 (4.61%) Master's Degree
7 15 (3.46%) Postgraduate
8 13 (3.00%) CFA
9 9 (2.07%) ACCA
10 8 (1.84%) CIMA
11 7 (1.61%) ITIL Certification
11 7 (1.61%) MBA
11 7 (1.61%) TOGAF Certification
12 6 (1.38%) SC Cleared
12 6 (1.38%) Security Cleared
13 5 (1.15%) Azure Certification
13 5 (1.15%) Cisco Certification
14 4 (0.92%) HND
14 4 (0.92%) Microsoft Certification
Quality Assurance & Compliance
1 49 (11.29%) GDPR
2 41 (9.45%) Accessibility
3 39 (8.99%) QA
4 29 (6.68%) Cyber Essentials
5 27 (6.22%) Cyber Essentials PLUS
6 14 (3.23%) ISO/IEC 27001
7 13 (3.00%) NIST
8 8 (1.84%) Actionable Recommendations
9 6 (1.38%) PMO
10 5 (1.15%) Data Quality
10 5 (1.15%) SLA
11 3 (0.69%) Sarbanes-Oxley
12 2 (0.46%) SOC 2
13 1 (0.23%) California Consumer Privacy Act
13 1 (0.23%) ISO 9001
13 1 (0.23%) WCAG
System Software
1 12 (2.76%) Active Directory
2 3 (0.69%) Virtual Desktop
2 3 (0.69%) VMware Infrastructure
3 2 (0.46%) Hyper-V
3 2 (0.46%) Virtual Servers
3 2 (0.46%) XenApp
3 2 (0.46%) XenDesktop
4 1 (0.23%) Docker
4 1 (0.23%) Virtual Machines
4 1 (0.23%) VMware ESXi
Systems Management
1 23 (5.30%) Terraform
2 22 (5.07%) Kubernetes
3 17 (3.92%) Ansible
4 4 (0.92%) Microsoft Intune
5 3 (0.69%) Grafana
5 3 (0.69%) SCCM
6 2 (0.46%) Single Sign-On
7 1 (0.23%) Backup Exec
Vendors
1 86 (19.82%) Microsoft
2 28 (6.45%) SAP
3 23 (5.30%) Salesforce
4 21 (4.84%) Cisco
5 14 (3.23%) Aruba
6 13 (3.00%) Fortinet
6 13 (3.00%) Mellanox
6 13 (3.00%) Murex
6 13 (3.00%) NVIDIA
6 13 (3.00%) Palo Alto
6 13 (3.00%) YouTube
7 11 (2.53%) BMC
7 11 (2.53%) Remedy
8 9 (2.07%) Facebook
8 9 (2.07%) Oracle
9 8 (1.84%) ForgeRock
9 8 (1.84%) Google
10 7 (1.61%) FIS
11 5 (1.15%) Adaptive Insights
11 5 (1.15%) Workday