Gaming
UK

The table below looks at the prevalence of the term Games in permanent job vacancies. Included is a benchmarking guide to the salaries offered in vacancies that cited Games over the 6 months leading up to 26 July 2024, comparing them to the same period in the previous two years.

6 months to
26 Jul 2024
Same period 2023 Same period 2022
Rank 246 141 84
Rank change year-on-year -105 -57 +67
Permanent jobs citing Games 992 2,062 6,970
As % of all permanent jobs advertised in the UK 1.10% 2.56% 3.98%
As % of the General category 1.92% 3.86% 5.89%
Number of salaries quoted 660 658 1,840
10th Percentile £27,500 £33,750 £36,250
25th Percentile £41,250 £46,250 £47,500
Median annual salary (50th Percentile) £55,000 £62,500 £65,000
Median % change year-on-year -12.00% -3.85% +13.04%
75th Percentile £67,500 £80,000 £85,000
90th Percentile £78,750 £97,875 £96,250
UK excluding London median annual salary £52,500 £55,613 £60,000
% change year-on-year -5.60% -7.31% +20.00%

All General Skills
UK

Games falls under the General Skills category. For comparison with the information above, the following table provides summary statistics for all permanent job vacancies requiring common skills.

Permanent vacancies with a requirement for common skills 51,660 53,362 118,305
As % of all permanent jobs advertised in the UK 57.16% 66.13% 67.50%
Number of salaries quoted 31,702 33,264 55,108
10th Percentile £28,500 £32,350 £32,500
25th Percentile £37,500 £42,750 £43,000
Median annual salary (50th Percentile) £54,000 £60,000 £60,000
Median % change year-on-year -10.00% - +6.19%
75th Percentile £72,557 £80,000 £80,000
90th Percentile £95,000 £100,000 £98,750
UK excluding London median annual salary £47,557 £52,500 £50,000
% change year-on-year -9.42% +5.00% +5.26%

Games
Job Vacancy Trend

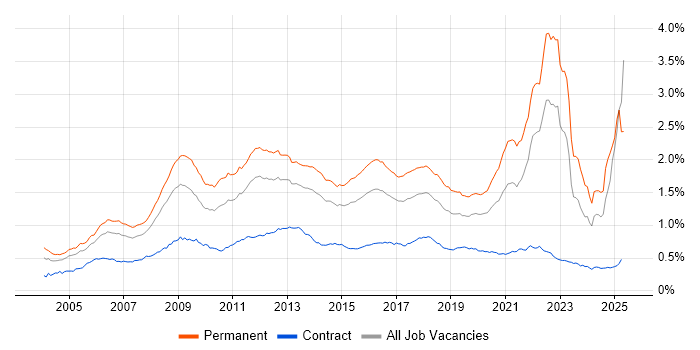
Job postings citing Games as a proportion of all IT jobs advertised.

Job vacancy trend for Games in the UK

Games
Salary Trend

3-month moving average salary quoted in jobs citing Games.

Salary trend for Games in the UK

Games
Salary Histogram

Salary distribution for jobs citing Games over the 6 months to 26 July 2024.

Salary histogram for Games in the UK

Games
Top 17 Job Locations

The table below looks at the demand and provides a guide to the median salaries quoted in IT jobs citing Games within the UK over the 6 months to 26 July 2024. The 'Rank Change' column provides an indication of the change in demand within each location based on the same 6 month period last year.

Location Rank Change
on Same Period
Last Year
Matching
Permanent
IT Job Ads
Median Salary
Past 6 Months
Median Salary
% Change
on Same Period
Last Year
Live
Jobs
England -119 824 £55,000 -12.00% 257
UK excluding London -132 682 £52,500 -5.60% 220
Work from Home +30 388 £52,500 -19.23% 93
London -70 246 £58,750 -16.07% 62
North of England -89 188 £52,500 -12.50% 56
Midlands -94 127 £50,000 +53.85% 50
South East -88 114 £50,000 -16.67% 57
West Midlands -47 107 £47,500 +47.29% 28
North West -102 98 £47,500 -9.52% 28
South West -27 92 £50,000 +5.26% 25
Scotland -128 70 £52,500 +7.69% 6
East of England -45 56 £60,000 -14.29% 23
Yorkshire -36 50 £50,000 -24.53% 21
North East +23 40 £60,000 +15.69% 7
Wales -18 35 £57,500 +15.00% 10
East Midlands -87 20 £65,000 +24.13% 22
Northern Ireland +7 3 £70,000 - 4

Games
Co-occurring Skills and Capabilities by Category

The follow tables expand on the table above by listing co-occurrences grouped by category. The same employment type, locality and period is covered with up to 20 co-occurrences shown in each of the following categories:

Application Platforms
1 42 (4.23%) Microsoft Exchange
2 29 (2.92%) Confluence
3 13 (1.31%) Apache Spark
4 9 (0.91%) Apache Solr
4 9 (0.91%) SharePoint
5 6 (0.60%) CMS
5 6 (0.60%) WordPress
6 4 (0.40%) Apache
6 4 (0.40%) Exchange Server 2000
7 3 (0.30%) Apache Airflow
7 3 (0.30%) nginx
8 2 (0.20%) Exchange Server 2010
8 2 (0.20%) Jupyter
8 2 (0.20%) OpenStack
9 1 (0.10%) Headless CMS
9 1 (0.10%) SAS
Applications
1 25 (2.52%) Microsoft Excel
2 24 (2.42%) Microsoft Office
3 10 (1.01%) Photoshop
4 8 (0.81%) AutoCAD
4 8 (0.81%) Blender
5 7 (0.71%) Maya
5 7 (0.71%) Microsoft Project
6 6 (0.60%) Adobe After Effects
6 6 (0.60%) Adobe Creative Suite
6 6 (0.60%) Adobe Illustrator
7 5 (0.50%) Microsoft PowerPoint
8 4 (0.40%) ZBrush
9 3 (0.30%) S-PLUS
10 2 (0.20%) Houdini
10 2 (0.20%) InDesign
10 2 (0.20%) Simulink
10 2 (0.20%) Sketch
10 2 (0.20%) Stateflow
11 1 (0.10%) MotionBuilder
11 1 (0.10%) Trello
Business Applications
1 24 (2.42%) Endur
2 4 (0.40%) SAP S/4HANA
3 2 (0.20%) Dynamics NAV
3 2 (0.20%) Elite 3E
3 2 (0.20%) Magento
4 1 (0.10%) Dynamics CRM
4 1 (0.10%) OpenLink RightAngle
Cloud Services
1 159 (16.03%) Azure
2 126 (12.70%) AWS
3 63 (6.35%) Microsoft 365
4 35 (3.53%) SaaS
5 27 (2.72%) GCP
6 19 (1.92%) Power Platform
7 18 (1.81%) Amazon S3
7 18 (1.81%) Entra ID
8 14 (1.41%) Amazon ECS
9 12 (1.21%) AWS Lambda
9 12 (1.21%) PaaS
9 12 (1.21%) Serverless
10 11 (1.11%) Azure DevOps
10 11 (1.11%) IaaS
11 10 (1.01%) Google Workspace
12 9 (0.91%) Asana
13 7 (0.71%) Azure Data Factory
13 7 (0.71%) GitHub
14 6 (0.60%) Azure AKS
15 5 (0.50%) MinIO
Communications & Networking
1 31 (3.13%) Wireless
2 27 (2.72%) Firewall
3 23 (2.32%) 5G
4 22 (2.22%) 3GPP
4 22 (2.22%) DNS
5 21 (2.12%) Radio Access Network
6 18 (1.81%) Internet
7 17 (1.71%) Broadband
8 16 (1.61%) WAN
9 15 (1.51%) LAN
10 10 (1.01%) Wi-Fi
11 9 (0.91%) NAS
12 8 (0.81%) HTTP
13 5 (0.50%) SAN
13 5 (0.50%) VPN
14 3 (0.30%) DHCP
14 3 (0.30%) VSAN
15 2 (0.20%) Ethernet
15 2 (0.20%) VoIP
15 2 (0.20%) WLAN
Database & Business Intelligence
1 74 (7.46%) SQL Server
2 43 (4.33%) PostgreSQL
3 40 (4.03%) Relational Database
4 35 (3.53%) MySQL
5 31 (3.13%) RDBMS
6 25 (2.52%) MongoDB
7 22 (2.22%) NoSQL
8 19 (1.92%) Power BI
9 18 (1.81%) Elasticsearch
9 18 (1.81%) Redis
10 13 (1.31%) Azure SQL Database
11 10 (1.01%) Amazon RDS
12 9 (0.91%) Data Warehouse
13 7 (0.71%) Data Lake
13 7 (0.71%) SQL Server Integration Services
14 6 (0.60%) Tableau
15 5 (0.50%) DynamoDB
15 5 (0.50%) Enterprise Data Warehouse
16 4 (0.40%) Couchbase
16 4 (0.40%) DTS
Development Applications
1 100 (10.08%) Git
2 45 (4.54%) JIRA
3 29 (2.92%) Bitbucket
4 27 (2.72%) Visual Studio
5 26 (2.62%) Jenkins
6 23 (2.32%) Sourcetree
7 12 (1.21%) gulp
8 11 (1.11%) Maven
9 10 (1.01%) Selenium
9 10 (1.01%) webpack
10 9 (0.91%) TeamCity
11 8 (0.81%) GitLab
12 5 (0.50%) JMeter
12 5 (0.50%) Vite
12 5 (0.50%) Zephyr
13 4 (0.40%) PostCSS
13 4 (0.40%) rollup.js
13 4 (0.40%) SonarQube
13 4 (0.40%) Team Foundation Server
14 3 (0.30%) Bugzilla
General
1 231 (23.29%) Social Skills
2 148 (14.92%) Finance
3 100 (10.08%) Inclusion and Diversity
4 90 (9.07%) Marketing
5 60 (6.05%) Analytical Skills
6 51 (5.14%) Retail
7 45 (4.54%) Manufacturing
7 45 (4.54%) Presentation Skills
8 43 (4.33%) Law
9 28 (2.82%) Banking
10 27 (2.72%) Legal
11 26 (2.62%) Financial Institution
11 26 (2.62%) Telecoms
12 23 (2.32%) Billing
13 21 (2.12%) Investment Banking
14 20 (2.02%) Influencing Skills
15 19 (1.92%) Aerospace
15 19 (1.92%) Electronics
16 18 (1.81%) Advertising
17 17 (1.71%) Public Sector
Job Titles
1 315 (31.75%) Developer
2 193 (19.46%) Senior
3 92 (9.27%) Games Developer
4 78 (7.86%) .NET Developer
5 74 (7.46%) Software Engineer
6 68 (6.85%) Lead
7 65 (6.55%) Senior Developer
8 56 (5.65%) Project Manager
9 48 (4.84%) C# Developer
10 45 (4.54%) Infrastructure Engineer
11 41 (4.13%) C# .NET Developer
12 39 (3.93%) Architect
13 31 (3.13%) Lead Developer
14 30 (3.02%) Blockchain Developer
14 30 (3.02%) Systems Engineer
15 29 (2.92%) Java Developer
16 28 (2.82%) Full Stack Developer
16 28 (2.82%) Senior Software Engineer
17 27 (2.72%) Principal Engineer
18 25 (2.52%) PHP Developer
Libraries, Frameworks & Software Standards
1 112 (11.29%) .NET
2 76 (7.66%) HTML
3 73 (7.36%) AngularJS
3 73 (7.36%) React
4 69 (6.96%) Unity (Game Engine)
5 58 (5.85%) RESTful
6 56 (5.65%) Node.js
7 47 (4.74%) CSS
8 43 (4.33%) ASP.NET Web API
9 39 (3.93%) .NET Core
10 35 (3.53%) Spring
11 31 (3.13%) Unreal Engine
11 31 (3.13%) Vue
11 31 (3.13%) web3js
12 30 (3.02%) HTML5
13 29 (2.92%) ASP.NET
14 28 (2.82%) .NET Framework
15 27 (2.72%) JSON
15 27 (2.72%) REST
16 26 (2.62%) Laravel
Miscellaneous
1 51 (5.14%) Virtual Reality
2 47 (4.74%) IoT
3 33 (3.33%) Management Information System
4 32 (3.23%) Blockchain
4 32 (3.23%) Web3
5 30 (3.02%) Animation
5 30 (3.02%) Self-Motivation
6 28 (2.82%) Cloud Native
6 28 (2.82%) Mobile Games
7 24 (2.42%) Swaptions
8 23 (2.32%) Online Games
8 23 (2.32%) Operational Technology
9 22 (2.22%) Product Ownership
10 20 (2.02%) Client/Server
11 19 (1.92%) Mobile App
12 16 (1.61%) Distributed Systems
13 15 (1.51%) Algorithms
13 15 (1.51%) Data Structures
14 14 (1.41%) Augmented Reality
14 14 (1.41%) e-Learning
Operating Systems
1 72 (7.26%) Windows
2 45 (4.54%) Linux
3 20 (2.02%) Android
4 19 (1.92%) Windows 10
5 18 (1.81%) Windows Server
6 11 (1.11%) Mac OS
7 10 (1.01%) Apple iOS
8 4 (0.40%) Unix
9 2 (0.20%) FreeRTOS
9 2 (0.20%) Windows Server 2012
10 1 (0.10%) CentOS
10 1 (0.10%) Mac OS X
10 1 (0.10%) Windows Server 2016
10 1 (0.10%) Windows Server 2019
Processes & Methodologies
1 185 (18.65%) Agile
2 139 (14.01%) Software Engineering
3 120 (12.10%) Problem-Solving
4 105 (10.58%) Computer Science
5 104 (10.48%) Full Stack Development
6 86 (8.67%) Artificial Intelligence
7 78 (7.86%) DevOps
8 77 (7.76%) Mentoring
9 76 (7.66%) Project Management
9 76 (7.66%) Scrum
10 75 (7.56%) Mathematics
11 69 (6.96%) Cybersecurity
12 67 (6.75%) Roadmaps
13 65 (6.55%) Machine Learning
14 62 (6.25%) SDLC
15 61 (6.15%) Analytics
16 58 (5.85%) Data Science
16 58 (5.85%) Decision-Making
17 56 (5.65%) Infrastructure Engineering
18 55 (5.54%) User Experience
Programming Languages
1 176 (17.74%) JavaScript
2 151 (15.22%) C#
3 124 (12.50%) Python
4 108 (10.89%) SQL
5 87 (8.77%) Java
6 68 (6.85%) TypeScript
7 62 (6.25%) C++
8 44 (4.44%) PHP
9 25 (2.52%) Bash
9 25 (2.52%) VB
10 21 (2.12%) C
11 12 (1.21%) RPG
12 10 (1.01%) Go
12 10 (1.01%) Groovy
12 10 (1.01%) PowerShell
13 7 (0.71%) Scala
14 6 (0.60%) Kotlin
15 5 (0.50%) ABAP
15 5 (0.50%) Rust
15 5 (0.50%) T-SQL
Qualifications
1 192 (19.35%) Degree
2 84 (8.47%) Security Cleared
3 45 (4.54%) SC Cleared
4 35 (3.53%) DBS Check
5 33 (3.33%) Computer Science Degree
6 30 (3.02%) BPSS Clearance
7 17 (1.71%) Master's Degree
8 7 (0.71%) A+ Certification
8 7 (0.71%) Chartered Engineer
9 6 (0.60%) MCP
9 6 (0.60%) PMP
10 5 (0.50%) DV Cleared
10 5 (0.50%) ITIL Foundation Certificate
10 5 (0.50%) Microsoft Certification
10 5 (0.50%) Numerate Degree
10 5 (0.50%) PhD
10 5 (0.50%) PMI Certification
11 4 (0.40%) CCNA CyberOps
11 4 (0.40%) CCNP
11 4 (0.40%) Network+ Certification
Quality Assurance & Compliance
1 43 (4.33%) QA
2 36 (3.63%) GDPR
3 14 (1.41%) Cyber Essentials
3 14 (1.41%) ISO/IEC 27001
4 9 (0.91%) SOC 2
5 7 (0.71%) ISO 9001
6 6 (0.60%) SLA
7 4 (0.40%) Software Quality Assurance
8 3 (0.30%) Accessibility
8 3 (0.30%) Data Quality
9 2 (0.20%) NIST
9 2 (0.20%) PCI DSS
9 2 (0.20%) PMO
10 1 (0.10%) COSHH
10 1 (0.10%) GRC
10 1 (0.10%) ISO 14001
10 1 (0.10%) ITGC
10 1 (0.10%) NCSC
10 1 (0.10%) NEBOSH
10 1 (0.10%) Sarbanes-Oxley
System Software
1 58 (5.85%) Docker
2 48 (4.84%) Active Directory
3 21 (2.12%) VMware Infrastructure
4 13 (1.31%) Virtual Machines
5 11 (1.11%) Hyper-V
6 3 (0.30%) VMware ESXi
7 2 (0.20%) Microsoft App-V
8 1 (0.10%) KVM
Systems Management
1 51 (5.14%) Kubernetes
2 21 (2.12%) Terraform
3 16 (1.61%) Microsoft Intune
4 9 (0.91%) Progress Chef
4 9 (0.91%) QRadar
4 9 (0.91%) Single Sign-On
5 8 (0.81%) Failover Clustering
6 7 (0.71%) Puppet
7 3 (0.30%) Ansible
7 3 (0.30%) Grafana
7 3 (0.30%) Istio
8 2 (0.20%) Argo
8 2 (0.20%) Kibana
8 2 (0.20%) SCCM
9 1 (0.10%) Prometheus
9 1 (0.10%) ZABBIX
Vendors
1 169 (17.04%) Microsoft
2 37 (3.73%) Oracle
3 31 (3.13%) Google
4 27 (2.72%) Apple
5 24 (2.42%) OpenLink
5 24 (2.42%) Sybase
5 24 (2.42%) TIBCO
6 21 (2.12%) VMware
7 19 (1.92%) IFS
8 18 (1.81%) Adobe
9 17 (1.71%) Workday
10 14 (1.41%) Dell
11 9 (0.91%) Cisco
11 9 (0.91%) Darktrace
12 6 (0.60%) Instagram
13 5 (0.50%) Draytek
13 5 (0.50%) EqualLogic
13 5 (0.50%) Nimble Storage
13 5 (0.50%) Salesforce
13 5 (0.50%) YouTube