GitLab
UK

The following table provides summary statistics for permanent job vacancies with a requirement for GitLab skills. Included is a benchmarking guide to the salaries offered in vacancies that have cited GitLab over the 6 months to 10 December 2023 with a comparison to the same period in the previous 2 years.

6 months to
10 Dec 2023
Same period 2022 Same period 2021
Rank 314 280 308
Rank change year-on-year -34 +28 -26
Permanent jobs citing GitLab 517 1,605 1,518
As % of all permanent jobs advertised in the UK 0.99% 1.31% 1.19%
As % of the Development Applications category 7.56% 7.35% 5.89%
Number of salaries quoted 361 796 883
10th Percentile £48,750 £46,250 £42,500
25th Percentile £53,750 £55,000 £52,500
Median annual salary (50th Percentile) £67,500 £75,000 £70,000
Median % change year-on-year -10.00% +7.14% +1.82%
75th Percentile £86,000 £90,000 £88,750
90th Percentile £105,000 £102,500 £105,000
UK excluding London median annual salary £62,500 £68,817 £55,000
% change year-on-year -9.18% +25.12% -8.33%

All Development Application Skills
UK

GitLab is in the Development Applications category. The following table is for comparison with the above and provides summary statistics for all permanent job vacancies with a requirement for development application skills.

Permanent vacancies with a requirement for development application skills 6,842 21,844 25,769
As % of all permanent jobs advertised in the UK 13.09% 17.87% 20.28%
Number of salaries quoted 5,216 12,549 16,287
10th Percentile £41,250 £39,750 £36,750
25th Percentile £50,000 £48,750 £45,000
Median annual salary (50th Percentile) £65,000 £65,000 £60,000
Median % change year-on-year - +8.33% +9.09%
75th Percentile £82,548 £82,500 £76,000
90th Percentile £100,000 £100,000 £91,250
UK excluding London median annual salary £58,000 £55,000 £50,000
% change year-on-year +5.45% +10.00% -

GitLab
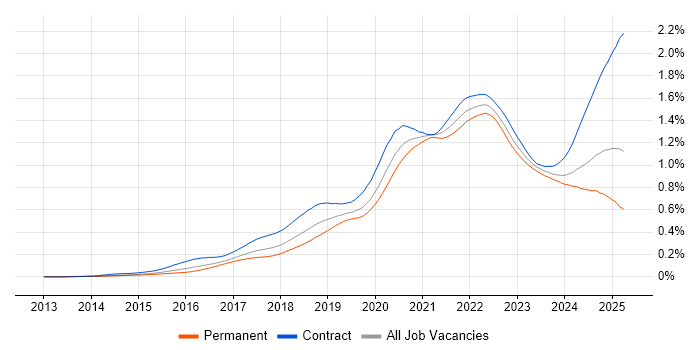
Job Vacancy Trend

Job postings citing GitLab as a proportion of all IT jobs advertised.

Job vacancy trend for GitLab in the UK

GitLab
Salary Trend

3-month moving average salary quoted in jobs citing GitLab.

Salary trend for GitLab in the UK

GitLab
Salary Histogram

Salary distribution for jobs citing GitLab over the 6 months to 10 December 2023.

Salary histogram for GitLab in the UK

GitLab
Top 17 Job Locations

The table below looks at the demand and provides a guide to the median salaries quoted in IT jobs citing GitLab within the UK over the 6 months to 10 December 2023. The 'Rank Change' column provides an indication of the change in demand within each location based on the same 6 month period last year.

Location Rank Change
on Same Period
Last Year
Matching
Permanent
IT Job Ads
Median Salary
Past 6 Months
Median Salary
% Change
on Same Period
Last Year
Live
Jobs
England -35 448 £67,500 -10.00% 188
UK excluding London -29 277 £62,500 -9.18% 115
Work from Home -12 248 £65,000 -12.86% 122
London -7 178 £82,500 - 95
South West +27 73 £62,500 +31.58% 21
North of England 0 72 £60,000 -7.69% 24
South East +102 47 £68,000 -2.86% 36
Yorkshire +19 34 £62,500 +25.00% 7
Wales +21 26 £60,000 +9.09% 3
North West +33 24 £60,000 -7.69% 15
Midlands -2 24 £57,500 -23.33% 6
West Midlands +28 19 £57,500 -23.33% 6
Scotland +18 19 £65,000 +8.33% 7
East of England +77 16 £82,500 +10.00% 14
North East +23 14 £58,750 -21.67% 2
East Midlands +14 5 £67,500 -3.57%
Northern Ireland +23 2 £75,000 +36.36% 5

GitLab
Co-occurring Skills and Capabilities by Category

The follow tables expand on the table above by listing co-occurrences grouped by category. The same employment type, locality and period is covered with up to 20 co-occurrences shown in each of the following categories:

Application Platforms
1 41 (7.93%) Confluence
2 24 (4.64%) SharePoint
3 22 (4.26%) IIS
3 22 (4.26%) WebLogic
4 7 (1.35%) nginx
5 6 (1.16%) Drupal
6 3 (0.58%) Apache Airflow
7 2 (0.39%) Apache
7 2 (0.39%) Cloud Foundry
7 2 (0.39%) CMS
7 2 (0.39%) ColdFusion
7 2 (0.39%) WordPress
8 1 (0.19%) Jupyter
8 1 (0.19%) MS Exchange
Applications
1 2 (0.39%) Campfire
2 1 (0.19%) Simulink
2 1 (0.19%) Stateflow
Business Applications
1 1 (0.19%) NetSuite
Cloud Services
1 284 (54.93%) AWS
2 213 (41.20%) Azure
3 117 (22.63%) GitHub
4 89 (17.21%) GCP
5 84 (16.25%) Serverless
6 82 (15.86%) AWS CloudFormation
7 74 (14.31%) Azure DevOps
8 56 (10.83%) Amazon EC2
9 53 (10.25%) GitHub Actions
10 42 (8.12%) Amazon S3
11 40 (7.74%) OpenShift
12 36 (6.96%) AWS Lambda
13 34 (6.58%) Amazon CloudWatch
14 31 (6.00%) Amazon EKS
15 29 (5.61%) Azure Monitor
16 27 (5.22%) Route 53
17 26 (5.03%) Cloud Computing
18 18 (3.48%) PaaS
19 17 (3.29%) Datadog
19 17 (3.29%) Virtual Private Cloud
Communications & Networking
1 20 (3.87%) DNS
2 12 (2.32%) AMQP
2 12 (2.32%) TCP/IP
3 10 (1.93%) Firewall
4 6 (1.16%) HTTP
4 6 (1.16%) VPN
5 4 (0.77%) SSL
6 3 (0.58%) Modbus
7 2 (0.39%) BGP
7 2 (0.39%) IPv6
7 2 (0.39%) LAN
7 2 (0.39%) SSH
7 2 (0.39%) WAN
8 1 (0.19%) Internet
8 1 (0.19%) IPv4
8 1 (0.19%) MPLS
8 1 (0.19%) OSPF
8 1 (0.19%) VLAN
8 1 (0.19%) Wi-Fi
8 1 (0.19%) Wireless
Database & Business Intelligence
1 48 (9.28%) Amazon RDS
2 45 (8.70%) SQL Server
3 41 (7.93%) Elasticsearch
4 30 (5.80%) MySQL
5 29 (5.61%) MongoDB
6 27 (5.22%) PostgreSQL
7 23 (4.45%) NoSQL
8 14 (2.71%) InfluxDB
9 12 (2.32%) Oracle Database
9 12 (2.32%) Oracle Database 10g
9 12 (2.32%) Oracle Database 11g
10 9 (1.74%) Amazon Redshift
11 8 (1.55%) DynamoDB
12 7 (1.35%) BigQuery
13 5 (0.97%) Apache Cassandra
13 5 (0.97%) Relational Database
14 4 (0.77%) Redis
15 3 (0.58%) DB2
15 3 (0.58%) Hazelcast
16 2 (0.39%) Data Warehouse
Development Applications
1 286 (55.32%) Jenkins
2 125 (24.18%) Git
3 100 (19.34%) JIRA
4 65 (12.57%) Artifactory
5 57 (11.03%) Sonatype Nexus
6 49 (9.48%) Maven
6 49 (9.48%) SonarQube
7 33 (6.38%) Cucumber
8 25 (4.84%) CircleCI
9 23 (4.45%) Postman
10 22 (4.26%) Selenium
11 19 (3.68%) REST Assured
12 18 (3.48%) JUnit
12 18 (3.48%) TeamCity
13 16 (3.09%) JMeter
14 14 (2.71%) Octopus Deploy
15 13 (2.51%) LoadRunner
16 12 (2.32%) ClearCase
16 12 (2.32%) eggPlant
16 12 (2.32%) SoapUI
General
1 94 (18.18%) Finance
2 64 (12.38%) Social Skills
3 50 (9.67%) Banking
4 46 (8.90%) Analytical Skills
5 33 (6.38%) Inclusion and Diversity
6 32 (6.19%) Investment Banking
7 30 (5.80%) Public Sector
8 22 (4.26%) Front Office
9 16 (3.09%) Games
10 10 (1.93%) Advertising
11 9 (1.74%) Retail
12 8 (1.55%) Financial Institution
13 6 (1.16%) Legal
13 6 (1.16%) Manufacturing
13 6 (1.16%) Marketing
14 5 (0.97%) Aviation
14 5 (0.97%) Influencing Skills
14 5 (0.97%) Telecoms
15 4 (0.77%) Automotive
16 3 (0.58%) Electronics
Job Titles
1 199 (38.49%) DevOps Engineer
2 85 (16.44%) Senior
3 71 (13.73%) Developer
4 70 (13.54%) AWS DevOps
5 68 (13.15%) AWS Engineer
6 65 (12.57%) AWS DevOps Engineer
7 56 (10.83%) Software Engineer
8 40 (7.74%) Lead
9 37 (7.16%) Analyst
10 36 (6.96%) Azure Engineer
11 35 (6.77%) Senior DevOps
12 34 (6.58%) Senior DevOps Engineer
13 33 (6.38%) Azure DevOps Engineer
14 30 (5.80%) Site Reliability Engineer
15 27 (5.22%) Architect
15 27 (5.22%) Python Engineer
16 24 (4.64%) Java Developer
17 23 (4.45%) Java Engineer
18 22 (4.26%) Applications Support
18 22 (4.26%) Applications Support Analyst
Libraries, Frameworks & Software Standards
1 79 (15.28%) Elastic Stack
2 69 (13.35%) .NET
3 67 (12.96%) Spring
4 48 (9.28%) React
5 36 (6.96%) Node.js
6 35 (6.77%) REST
7 34 (6.58%) CSS
8 33 (6.38%) RabbitMQ
9 29 (5.61%) HTML
9 29 (5.61%) Spring Boot
10 26 (5.03%) LDAP
11 24 (4.64%) JSON
12 22 (4.26%) J2EE
12 22 (4.26%) Java EE
13 20 (3.87%) Gherkin
14 18 (3.48%) .NET Framework
15 16 (3.09%) Kafka
16 15 (2.90%) WireMock
17 14 (2.71%) Flask
18 13 (2.51%) Jest
Miscellaneous
1 68 (13.15%) Private Cloud
2 22 (4.26%) Cloud Native
3 21 (4.06%) Distributed Systems
4 18 (3.48%) Public Cloud
5 17 (3.29%) Virtual Team
6 15 (2.90%) Greenfield Project
6 15 (2.90%) Mobile App
7 12 (2.32%) Blog
7 12 (2.32%) Sports Betting
8 8 (1.55%) Management Information System
8 8 (1.55%) Onboarding
8 8 (1.55%) Self-Motivation
9 7 (1.35%) Data Structures
9 7 (1.35%) Legacy Applications
9 7 (1.35%) Linux Command Line
10 6 (1.16%) CMDB
11 5 (0.97%) Algorithms
11 5 (0.97%) Renewable Energy
11 5 (0.97%) Team-Oriented Environment
12 4 (0.77%) Hedge funds
Operating Systems
1 173 (33.46%) Linux
2 86 (16.63%) Windows
3 48 (9.28%) Unix
4 27 (5.22%) Red Hat Enterprise Linux
5 25 (4.84%) Android
6 21 (4.06%) Ubuntu
7 18 (3.48%) Windows Server
8 13 (2.51%) VMS
9 12 (2.32%) Debian
10 5 (0.97%) CentOS
11 3 (0.58%) Apple iOS
11 3 (0.58%) Embedded Linux
12 2 (0.39%) Mac OS
12 2 (0.39%) Windows Server 2019
13 1 (0.19%) QNX Neutrino
Processes & Methodologies
1 333 (64.41%) CI/CD
2 323 (62.48%) DevOps
3 234 (45.26%) Agile
4 179 (34.62%) Containerisation
5 144 (27.85%) Software Engineering
6 138 (26.69%) Infrastructure as Code
7 130 (25.15%) Continuous Integration
8 115 (22.24%) Microservices
9 109 (21.08%) Problem-Solving
10 102 (19.73%) Scrum
11 88 (17.02%) Test Automation
12 74 (14.31%) Kanban
13 65 (12.57%) Open Source
14 55 (10.64%) Configuration Management
15 50 (9.67%) Artificial Intelligence
16 49 (9.48%) Actionable Insight
17 45 (8.70%) Analytics
18 43 (8.32%) Site Reliability Engineering
19 42 (8.12%) Mentoring
20 40 (7.74%) Computer Science
Programming Languages
1 236 (45.65%) Java
2 218 (42.17%) Python
3 109 (21.08%) Bash
4 95 (18.38%) PowerShell
5 86 (16.63%) C#
6 70 (13.54%) JavaScript
7 65 (12.57%) SQL
8 62 (11.99%) Go
9 60 (11.61%) Ruby
10 43 (8.32%) Perl
11 32 (6.19%) TypeScript
12 27 (5.22%) C++
13 23 (4.45%) C
14 18 (3.48%) Groovy
15 17 (3.29%) Shell Script
16 16 (3.09%) PHP
17 15 (2.90%) Kotlin
18 14 (2.71%) Korn
19 12 (2.32%) Tcl
20 9 (1.74%) Bicep
Qualifications
1 134 (25.92%) Security Cleared
2 107 (20.70%) SC Cleared
3 43 (8.32%) Degree
4 31 (6.00%) AWS Certification
5 29 (5.61%) BPSS Clearance
6 21 (4.06%) Computer Science Degree
7 17 (3.29%) AWS Certified DevOps Engineer
8 15 (2.90%) Azure Certification
9 12 (2.32%) Microsoft Certification
10 10 (1.93%) Master's Degree
11 8 (1.55%) AWS Certified SysOps Administrator
12 7 (1.35%) AWS Certified Solutions Architect
13 4 (0.77%) DV Cleared
14 2 (0.39%) AWS Certified Developer
14 2 (0.39%) Cisco Certification
15 1 (0.19%) CCIE
15 1 (0.19%) CCNA
15 1 (0.19%) ISTQB Foundation Certification
15 1 (0.19%) Numerate Degree
15 1 (0.19%) OCP
Quality Assurance & Compliance
1 49 (9.48%) QA
2 22 (4.26%) SLA
3 8 (1.55%) Accessibility
4 6 (1.16%) AUTOSAR
4 6 (1.16%) ISO/IEC 27001
5 5 (0.97%) GDPR
6 1 (0.19%) Data Quality
6 1 (0.19%) ISO 26262
6 1 (0.19%) JTAG
6 1 (0.19%) MISRA
6 1 (0.19%) PSD2
6 1 (0.19%) RMADS
6 1 (0.19%) SOC 2
System Software
1 265 (51.26%) Docker
2 39 (7.54%) Active Directory
3 15 (2.90%) Virtual Machines
4 7 (1.35%) VMware Infrastructure
5 3 (0.58%) Citrix Hypervisor
5 3 (0.58%) LXC
6 2 (0.39%) Hyper-V
7 1 (0.19%) iptables
7 1 (0.19%) Virtual Desktop
7 1 (0.19%) VirtualBox
Systems Management
1 298 (57.64%) Kubernetes
2 235 (45.45%) Terraform
3 132 (25.53%) Ansible
4 64 (12.38%) Grafana
5 58 (11.22%) Prometheus
6 40 (7.74%) Puppet
7 30 (5.80%) Packer
8 27 (5.22%) Argo
9 24 (4.64%) Single Sign-On
10 23 (4.45%) Rancher
11 22 (4.26%) AirWatch
11 22 (4.26%) OpenSSO
12 21 (4.06%) Progress Chef
13 15 (2.90%) Red Hat Satellite
14 13 (2.51%) HP Quality Center
15 12 (2.32%) Kustomize
16 9 (1.74%) Kibana
17 6 (1.16%) ZABBIX
18 5 (0.97%) Consul
18 5 (0.97%) Nagios
Vendors
1 85 (16.44%) Microsoft
2 45 (8.70%) Oracle
3 35 (6.77%) Google
4 27 (5.22%) Splunk
5 21 (4.06%) Red Hat
6 18 (3.48%) AppDynamics
7 15 (2.90%) Sun
7 15 (2.90%) TOWER Software
7 15 (2.90%) VMware
8 13 (2.51%) Atlassian
9 12 (2.32%) MKS
10 10 (1.93%) HP
11 7 (1.35%) Checkmarx
12 6 (1.16%) McAfee
13 5 (0.97%) Dynatrace
14 4 (0.77%) Veracode
15 3 (0.58%) Databricks
15 3 (0.58%) IBM
15 3 (0.58%) New Relic
16 2 (0.39%) F5