Product Roadmaps
UK

The following table provides summary statistics for permanent job vacancies with a requirement for Product Roadmap skills. Included is a benchmarking guide to the salaries offered in vacancies that have cited Product Roadmap over the 6 months to 4 December 2023 with a comparison to the same period in the previous 2 years.

6 months to
4 Dec 2023
Same period 2022 Same period 2021
Rank 281 189 218
Rank change year-on-year -92 +29 +64
Permanent jobs citing Product Roadmap 623 2,485 2,202
As % of all permanent jobs advertised in the UK 1.17% 2.00% 1.72%
As % of the Processes & Methodologies category 1.24% 2.09% 1.80%
Number of salaries quoted 499 1,069 1,447
10th Percentile £47,450 £47,500 £43,750
25th Percentile £57,250 £55,000 £52,500
Median annual salary (50th Percentile) £70,000 £70,000 £67,500
Median % change year-on-year - +3.70% +8.00%
75th Percentile £92,500 £86,250 £90,000
90th Percentile £110,000 £100,000 £112,500
UK excluding London median annual salary £62,000 £65,000 £60,000
% change year-on-year -4.62% +8.33% +3.00%

All Process and Methodology Skills
UK

Product Roadmap is in the Processes and Methodologies category. The following table is for comparison with the above and provides summary statistics for all permanent job vacancies with a requirement for process or methodology skills.

Permanent vacancies with a requirement for process or methodology skills 50,088 118,671 122,416
As % of all permanent jobs advertised in the UK 94.09% 95.74% 95.45%
Number of salaries quoted 36,209 72,079 81,851
10th Percentile £32,500 £34,492 £32,500
25th Percentile £43,750 £45,000 £42,500
Median annual salary (50th Percentile) £60,000 £60,000 £60,000
Median % change year-on-year - - +9.09%
75th Percentile £80,000 £82,000 £77,500
90th Percentile £99,025 £100,000 £95,000
UK excluding London median annual salary £52,500 £53,219 £50,000
% change year-on-year -1.35% +6.44% +4.17%

Product Roadmap
Job Vacancy Trend

Job postings citing Product Roadmap as a proportion of all IT jobs advertised.
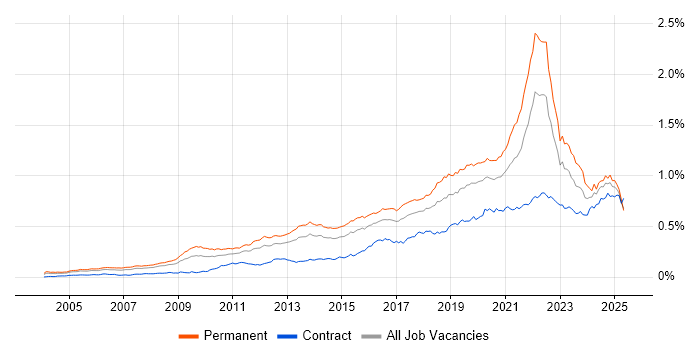
Job vacancy trend for Product Roadmap in the UK

Product Roadmap
Salary Trend

3-month moving average salary quoted in jobs citing Product Roadmap.

Salary trend for Product Roadmap in the UK

Product Roadmap
Salary Histogram

Salary distribution for jobs citing Product Roadmap over the 6 months to 4 December 2023.

Salary histogram for Product Roadmap in the UK

Product Roadmap
Top 16 Job Locations

The table below looks at the demand and provides a guide to the median salaries quoted in IT jobs citing Product Roadmap within the UK over the 6 months to 4 December 2023. The 'Rank Change' column provides an indication of the change in demand within each location based on the same 6 month period last year.

Location Rank Change
on Same Period
Last Year
Matching
Permanent
IT Job Ads
Median Salary
Past 6 Months
Median Salary
% Change
on Same Period
Last Year
Live
Jobs
England -88 557 £71,750 -0.35% 414
UK excluding London -112 324 £62,000 -4.62% 231
London -30 273 £82,750 +7.82% 193
Work from Home -138 265 £75,000 +3.45% 201
North of England -66 98 £61,000 -12.86% 71
South East -31 58 £60,000 -14.29% 61
North West -57 55 £61,000 -6.15% 37
East of England +64 46 £71,500 +2.14% 23
Midlands -84 38 £60,000 +7.60% 29
Yorkshire -20 35 £72,500 -12.77% 21
South West +15 34 £60,000 - 30
Scotland +30 32 £77,510 +40.93% 14
West Midlands -39 29 £65,000 +4.00% 25
Wales +21 18 £65,500 -6.43% 2
East Midlands -31 9 £60,000 +20.00% 4
North East +45 8 £59,250 +7.73% 13

Product Roadmap
Co-occurring Skills and Capabilities by Category

The follow tables expand on the table above by listing co-occurrences grouped by category. The same employment type, locality and period is covered with up to 20 co-occurrences shown in each of the following categories:

Application Platforms
1 18 (2.89%) Confluence
2 9 (1.44%) SharePoint
3 5 (0.80%) CMS
4 2 (0.32%) Drupal
5 1 (0.16%) Apache Airflow
5 1 (0.16%) Apache Spark
5 1 (0.16%) IIS
Applications
1 10 (1.61%) Microsoft Office
2 7 (1.12%) Microsoft Excel
3 5 (0.80%) Chatbot
4 3 (0.48%) MS Visio
5 2 (0.32%) Microsoft PowerPoint
5 2 (0.32%) Trello
6 1 (0.16%) Siemens NX
Business Applications
1 29 (4.65%) Unit4 Business World
2 16 (2.57%) SAP S/4HANA
3 9 (1.44%) Dynamics CRM
4 8 (1.28%) Distributed Ledger
5 3 (0.48%) Teamcenter
6 2 (0.32%) Eloqua
6 2 (0.32%) SAP SRM
7 1 (0.16%) Magento
7 1 (0.16%) Oracle CRM
7 1 (0.16%) Sage X3
7 1 (0.16%) Salesforce CRM
7 1 (0.16%) SAP BPC
7 1 (0.16%) SAP CO
7 1 (0.16%) SAP FI
7 1 (0.16%) SAP FI/CO
7 1 (0.16%) Siebel CRM
Cloud Services
1 128 (20.55%) Azure
2 91 (14.61%) AWS
3 60 (9.63%) SaaS
4 35 (5.62%) Azure DevOps
5 31 (4.98%) GCP
6 29 (4.65%) Power Platform
7 25 (4.01%) OpenShift
8 22 (3.53%) Serverless
9 16 (2.57%) Microsoft 365
10 11 (1.77%) Azure Service Bus
11 8 (1.28%) Azure API Management
11 8 (1.28%) Azure Functions
11 8 (1.28%) Azure Sentinel
12 7 (1.12%) GitHub
12 7 (1.12%) PowerApps
13 6 (0.96%) Entra ID
14 5 (0.80%) Azure Cosmos DB
14 5 (0.80%) Dynamics 365
14 5 (0.80%) GitHub Actions
14 5 (0.80%) WhatsApp
Communications & Networking
1 10 (1.61%) Internet
2 4 (0.64%) Radio Access Network
2 4 (0.64%) WAAS
3 3 (0.48%) 3GPP
3 3 (0.48%) Network Security
4 2 (0.32%) Ethernet
4 2 (0.32%) Firewall
4 2 (0.32%) LAN
4 2 (0.32%) WAN
5 1 (0.16%) ADSL
5 1 (0.16%) CTI
5 1 (0.16%) DNS
5 1 (0.16%) DWDM
5 1 (0.16%) HTTP
5 1 (0.16%) MPLS
5 1 (0.16%) SDH
5 1 (0.16%) TCP/IP
5 1 (0.16%) VoIP
5 1 (0.16%) VPN
5 1 (0.16%) Wi-Fi
Database & Business Intelligence
1 31 (4.98%) MySQL
2 30 (4.82%) PostgreSQL
3 29 (4.65%) MongoDB
4 27 (4.33%) Elasticsearch
5 26 (4.17%) Amazon Redshift
5 26 (4.17%) SQL Server
6 19 (3.05%) NoSQL
7 17 (2.73%) Data Warehouse
7 17 (2.73%) Tableau
8 13 (2.09%) Azure SQL Database
9 10 (1.61%) Amazon QuickSight
9 10 (1.61%) Data Mining
9 10 (1.61%) Power BI
10 5 (0.80%) Data Lake
11 4 (0.64%) SQL Server Integration Services
12 3 (0.48%) QlikView
12 3 (0.48%) Redis
12 3 (0.48%) SQL Server Reporting Services
13 2 (0.32%) Crystal Reports
13 2 (0.32%) Relational Database
Development Applications
1 31 (4.98%) JIRA
2 26 (4.17%) Jenkins
2 26 (4.17%) Selenium
3 25 (4.01%) Cucumber
3 25 (4.01%) Cypress.io
4 15 (2.41%) Git
5 4 (0.64%) Visual Studio
6 3 (0.48%) TeamCity
6 3 (0.48%) Visual Studio Team System
7 2 (0.32%) Jasmine
7 2 (0.32%) SonarQube
7 2 (0.32%) Visual Studio Code
8 1 (0.16%) Artifactory
8 1 (0.16%) Browser DevTools
8 1 (0.16%) GoCD
8 1 (0.16%) Postman
8 1 (0.16%) Redmine
8 1 (0.16%) SoapUI
8 1 (0.16%) Storybook
8 1 (0.16%) Visual Website Optimizer
General
1 174 (27.93%) Finance
2 155 (24.88%) Social Skills
3 107 (17.17%) Analytical Skills
4 57 (9.15%) Inclusion and Diversity
5 51 (8.19%) Marketing
6 43 (6.90%) Banking
7 41 (6.58%) Legal
8 38 (6.10%) Retail
9 33 (5.30%) Influencing Skills
10 28 (4.49%) Public Sector
11 27 (4.33%) Back Office
12 24 (3.85%) Pharmaceutical
13 20 (3.21%) Manufacturing
14 17 (2.73%) Digital Healthcare
15 14 (2.25%) Aerospace
16 11 (1.77%) Billing
16 11 (1.77%) Organisational Skills
17 10 (1.61%) Electronics
18 9 (1.44%) Games
19 8 (1.28%) Law
Job Titles
1 153 (24.56%) Product Owner
2 120 (19.26%) Senior
3 98 (15.73%) Product Manager
4 83 (13.32%) Lead
5 40 (6.42%) Software Engineer
6 32 (5.14%) Developer
7 28 (4.49%) Architect
8 21 (3.37%) Analyst
8 21 (3.37%) Digital Product Owner
9 17 (2.73%) Service Manager
10 16 (2.57%) Business Analyst
11 15 (2.41%) Lead Software Engineer
11 15 (2.41%) Senior Manager
12 14 (2.25%) Consultant
13 13 (2.09%) Technical Leader
14 12 (1.93%) Data Manager
14 12 (1.93%) Project Manager
14 12 (1.93%) Solutions Architect
15 11 (1.77%) Functional Consultant
15 11 (1.77%) Infrastructure Engineer
Libraries, Frameworks & Software Standards
1 34 (5.46%) React
2 27 (4.33%) .NET
3 26 (4.17%) gRPC
4 18 (2.89%) Node.js
5 15 (2.41%) RESTful
6 12 (1.93%) REST
7 9 (1.44%) Middleware
7 9 (1.44%) Web Services
8 8 (1.28%) HTML
9 7 (1.12%) CSS
10 6 (0.96%) SOAP
10 6 (0.96%) Velocity
11 5 (0.80%) .NET Core
12 4 (0.64%) AngularJS
13 3 (0.48%) EDI
13 3 (0.48%) WPF
13 3 (0.48%) XML
14 2 (0.32%) Laravel
14 2 (0.32%) OAuth
14 2 (0.32%) SVG
Miscellaneous
1 251 (40.29%) Product Ownership
2 27 (4.33%) Onboarding
3 26 (4.17%) Public Cloud
4 22 (3.53%) Virtual Team
5 19 (3.05%) Blockchain
6 16 (2.57%) Culture of Ownership
6 16 (2.57%) IoT
7 14 (2.25%) Enterprise Software
8 13 (2.09%) Self-Motivation
9 12 (1.93%) Cloud Native
9 12 (1.93%) Data Centre
10 11 (1.77%) Low-Code
11 10 (1.61%) Hybrid Cloud
11 10 (1.61%) Management Information System
12 9 (1.44%) Housing Association
13 8 (1.28%) Mobile App
14 7 (1.12%) Driving Licence
14 7 (1.12%) Legacy Code
15 5 (0.80%) Robotics
16 4 (0.64%) Data Structures
Operating Systems
1 4 (0.64%) Linux
2 3 (0.48%) Android
2 3 (0.48%) Apple iOS
2 3 (0.48%) Windows
3 1 (0.16%) Embedded Linux
Processes & Methodologies
1 623 (100.00%) Roadmaps
2 359 (57.62%) Agile
3 146 (23.43%) Scrum
4 133 (21.35%) Product Backlog
5 132 (21.19%) User Stories
6 126 (20.22%) DevOps
7 113 (18.14%) Product Management
8 98 (15.73%) Product Strategy
9 96 (15.41%) User Experience
10 82 (13.16%) Software Engineering
11 81 (13.00%) Problem-Solving
12 80 (12.84%) Product Vision
13 79 (12.68%) Stakeholder Management
14 78 (12.52%) Acceptance Criteria
15 70 (11.24%) Backlog Prioritisation
16 66 (10.59%) Continuous Improvement
17 62 (9.95%) Backlog Management
18 60 (9.63%) Strategic Roadmap
19 58 (9.31%) Analytics
20 55 (8.83%) Mentoring
Programming Languages
1 113 (18.14%) SQL
2 64 (10.27%) Python
3 43 (6.90%) Java
4 39 (6.26%) JavaScript
5 30 (4.82%) Kotlin
6 29 (4.65%) C#
7 27 (4.33%) Go
8 25 (4.01%) C++
9 11 (1.77%) TypeScript
10 9 (1.44%) Bash
11 6 (0.96%) VB
12 4 (0.64%) C
12 4 (0.64%) Embedded C
12 4 (0.64%) PHP
12 4 (0.64%) R
13 3 (0.48%) PowerShell
14 2 (0.32%) MATLAB
14 2 (0.32%) Ruby
15 1 (0.16%) BrightScript
15 1 (0.16%) Objective-C
Qualifications
1 76 (12.20%) Degree
2 32 (5.14%) Security Cleared
3 16 (2.57%) SC Cleared
4 10 (1.61%) Azure Certification
4 10 (1.61%) Computer Science Degree
5 9 (1.44%) BPSS Clearance
6 7 (1.12%) CSPO
7 6 (0.96%) Master's Degree
8 5 (0.80%) Microsoft Certification
8 5 (0.80%) SAFe Agilist
9 4 (0.64%) CISSP
10 3 (0.48%) AWS Certification
10 3 (0.48%) Cisco Certification
10 3 (0.48%) CISM
10 3 (0.48%) PMI Certification
11 2 (0.32%) CCNA
11 2 (0.32%) CCNP
11 2 (0.32%) MCAD
11 2 (0.32%) PMP
12 1 (0.16%) AWS Certified Solutions Architect
Quality Assurance & Compliance
1 19 (3.05%) Accessibility
2 14 (2.25%) QA
3 9 (1.44%) GDPR
4 8 (1.28%) EMIR
4 8 (1.28%) MiFID
5 4 (0.64%) ISO/IEC 27001
6 3 (0.48%) Data Quality
7 2 (0.32%) COBIT
7 2 (0.32%) GRC
7 2 (0.32%) PSD2
8 1 (0.16%) Actionable Recommendations
8 1 (0.16%) GxP
8 1 (0.16%) ISO 22301
8 1 (0.16%) PMO
8 1 (0.16%) Sarbanes-Oxley
System Software
1 54 (8.67%) Docker
2 7 (1.12%) Active Directory
3 6 (0.96%) VMware Infrastructure
4 4 (0.64%) BitLocker
4 4 (0.64%) Virtual Desktop
4 4 (0.64%) VMware ESXi
5 3 (0.48%) Firmware
6 1 (0.16%) Hyper-V
6 1 (0.16%) Virtual Machines
Systems Management
1 60 (9.63%) Kubernetes
2 11 (1.77%) Terraform
3 6 (0.96%) Microsoft Intune
4 4 (0.64%) SCCM
4 4 (0.64%) vCenter Server
5 1 (0.16%) Ansible
5 1 (0.16%) Grafana
5 1 (0.16%) NetBackup
Vendors
1 50 (8.03%) Microsoft
2 30 (4.82%) SAP
3 12 (1.93%) Google
4 11 (1.77%) Salesforce
5 10 (1.61%) YouTube
6 7 (1.12%) Atlassian
6 7 (1.12%) VMware
7 6 (0.96%) Siemens
8 5 (0.80%) ServiceNow
9 4 (0.64%) CheckPoint
9 4 (0.64%) Citrix
10 3 (0.48%) Alteryx
10 3 (0.48%) Ariba
10 3 (0.48%) Oracle
10 3 (0.48%) Veeam
11 2 (0.32%) ABBYY
11 2 (0.32%) Blue Prism
11 2 (0.32%) Concur
11 2 (0.32%) Facebook
11 2 (0.32%) IFS