Performance Monitoring Job Trends

Performance Monitoring
UK

The table below provides summary statistics and salary benchmarking for jobs requiring Performance Monitoring skills. It covers permanent job vacancies from the 6 months leading up to 2 November 2025, with comparisons to the same periods in the previous two years.

6 months to
2 Nov 2025
Same period 2024 Same period 2023
Rank 428 473 507
Rank change year-on-year +45 +34 +193
Permanent jobs citing Performance Monitoring 253 277 236
As % of all permanent jobs in the UK 0.50% 0.41% 0.44%
As % of the Processes & Methodologies category 0.58% 0.49% 0.47%
Number of salaries quoted 155 149 166
10th Percentile £36,248 £37,250 £39,250
25th Percentile £43,125 £41,250 £44,250
Median annual salary (50th Percentile) £62,500 £53,000 £55,000
Median % change year-on-year +17.92% -3.64% -
75th Percentile £75,000 £74,144 £69,800
90th Percentile £95,750 £78,900 £76,875
UK excluding London median annual salary £55,971 £50,000 £52,500
% change year-on-year +11.94% -4.76% +5.00%

All Process and Methodology Skills
UK

Performance Monitoring falls under the Processes and Methodologies category. For comparison with the information above, the following table provides summary statistics for all permanent job vacancies requiring process or methodology skills.

Permanent vacancies with a requirement for process or methodology skills 43,892 56,113 50,704
As % of all permanent jobs advertised in the UK 87.48% 82.56% 93.95%
Number of salaries quoted 25,743 29,547 38,931
10th Percentile £28,250 £33,750 £32,500
25th Percentile £35,717 £45,000 £44,000
Median annual salary (50th Percentile) £54,000 £60,000 £60,000
Median % change year-on-year -10.00% - -
75th Percentile £75,000 £78,750 £80,000
90th Percentile £95,000 £97,500 £98,000
UK excluding London median annual salary £46,500 £54,000 £52,500
% change year-on-year -13.89% +2.86% -

Performance Monitoring
Job Vacancy Trend

Historical trend showing the proportion of permanent IT job postings citing Performance Monitoring relative to all permanent IT jobs advertised.
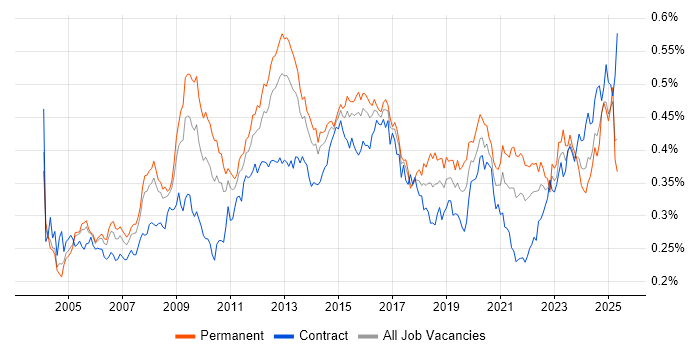
Performance Monitoring job vacancy trend in the UK

Performance Monitoring
Salary Trend

Salary distribution trend for jobs in the UK citing Performance Monitoring.

Salary distribution trend for jobs in the UK citing Performance Monitoring

Performance Monitoring
Salary Histogram

Salary distribution for jobs citing Performance Monitoring over the 6 months to 2 November 2025.

Salary histogram for Performance Monitoring in the UK

Performance Monitoring
Top 17 Job Locations

The table below looks at the demand and provides a guide to the median salaries quoted in IT jobs citing Performance Monitoring within the UK over the 6 months to 2 November 2025. The 'Rank Change' column provides an indication of the change in demand within each location based on the same 6 month period last year.

Location Rank Change
on Same Period
Last Year
Matching
Permanent
IT Job Ads
Median Salary
Past 6 Months
Median Salary
% Change
on Same Period
Last Year
Live
Jobs
England +64 215 £62,500 +19.05% 145
UK excluding London +40 166 £55,971 +11.94% 117
Work from Home +18 97 £58,500 -8.24% 70
London +88 72 £70,000 -6.98% 75
North of England +48 51 £65,000 -1.37% 21
South East +39 43 £65,000 +44.44% 55
North West +27 34 £65,000 +4.00% 7
South West +22 21 £36,000 -6.49% 7
Midlands +20 18 £40,000 -5.88% 13
East of England +17 16 £55,000 +10.00% 9
Yorkshire +27 14 £65,000 +52.94% 12
East Midlands +18 12 £40,000 -4.76% 3
Northern Ireland +12 12 £73,801 +6.48% 3
Wales +17 8 £44,336 -36.03% 1
West Midlands +28 6 £59,527 -6.62% 10
Scotland -17 4 £73,801 +39.25% 10
North East +9 3 £73,801 +6.48% 4

Performance Monitoring
Co-Occurring Skills & Capabilities by Category

The following tables expand on the one above by listing co-occurrences grouped by category. They cover the same employment type, locality and period, with up to 20 co-occurrences shown in each category:

Application Platforms
1 6 (2.37%) Confluence
2 3 (1.19%) IIS
3 2 (0.79%) FactoryTalk
3 2 (0.79%) nginx
3 2 (0.79%) SharePoint
3 2 (0.79%) Tomcat
3 2 (0.79%) WinCC
4 1 (0.40%) Appian
4 1 (0.40%) BizTalk Server
4 1 (0.40%) CMS
4 1 (0.40%) JBoss
4 1 (0.40%) WordPress
Applications
1 37 (14.62%) Microsoft Excel
2 6 (2.37%) Microsoft Office
3 3 (1.19%) Adobe Creative Suite
3 3 (1.19%) Microsoft PowerPoint
4 2 (0.79%) Microsoft Project
4 2 (0.79%) Oracle Smart View
5 1 (0.40%) Spreadsheet
Business Applications
1 6 (2.37%) SAP WM
2 5 (1.98%) Payment Gateway
2 5 (1.98%) PlanetPress Connect
3 3 (1.19%) SAP APO
3 3 (1.19%) SAP ERP
3 3 (1.19%) SAP IBP
3 3 (1.19%) SAP S/4HANA
4 2 (0.79%) Dynamics CRM
4 2 (0.79%) Hyperion Planning
4 2 (0.79%) Integrated Workplace Management System
4 2 (0.79%) OpenCart
4 2 (0.79%) Oracle Assets
4 2 (0.79%) Oracle Financials
4 2 (0.79%) Oracle General Ledger
4 2 (0.79%) Oracle Payables
4 2 (0.79%) Oracle Receivables
4 2 (0.79%) SAP CO
4 2 (0.79%) SAP FI
4 2 (0.79%) SAP FI/CO
5 1 (0.40%) Dynamics GP
Cloud Services
1 66 (26.09%) Azure
2 41 (16.21%) AWS
2 41 (16.21%) Power Platform
3 24 (9.49%) Azure Synapse Analytics
4 23 (9.09%) Azure Data Factory
5 18 (7.11%) Serverless
6 17 (6.72%) GCP
7 16 (6.32%) AWS Lambda
8 15 (5.93%) Vertex AI
9 12 (4.74%) AWS CloudFormation
10 10 (3.95%) Amazon EC2
10 10 (3.95%) GitHub
11 9 (3.56%) Azure Monitor
11 9 (3.56%) SaaS
12 8 (3.16%) Amazon ECR
12 8 (3.16%) Amazon ECS
12 8 (3.16%) dbt
12 8 (3.16%) Google Analytics
12 8 (3.16%) Pulumi
13 7 (2.77%) Amazon S3
Communications & Networking
1 11 (4.35%) Firewall
2 9 (3.56%) TCP/IP
3 3 (1.19%) DNS
3 3 (1.19%) LAN
3 3 (1.19%) SAN
4 2 (0.79%) Ethernet
4 2 (0.79%) Fibre Channel
4 2 (0.79%) Wi-Fi
4 2 (0.79%) Wireless
5 1 (0.40%) HTTP
5 1 (0.40%) Internet
5 1 (0.40%) Network Security
5 1 (0.40%) VoIP
5 1 (0.40%) X.21
Database & Business Intelligence
1 39 (15.42%) Power BI
2 20 (7.91%) SQL Server
3 16 (6.32%) Azure SQL Database
3 16 (6.32%) DynamoDB
4 15 (5.93%) Amazon RDS
4 15 (5.93%) Data Mining
4 15 (5.93%) SQL Server Reporting Services
5 11 (4.35%) Data Warehouse
6 10 (3.95%) Elasticsearch
7 9 (3.56%) PostgreSQL
7 9 (3.56%) Redis
8 8 (3.16%) Tableau
9 5 (1.98%) NoSQL
9 5 (1.98%) SQL Server Analysis Services
10 4 (1.58%) Data Lake
10 4 (1.58%) Metadata
10 4 (1.58%) SQL Server Integration Services
11 2 (0.79%) Amazon Redshift
11 2 (0.79%) Essbase
11 2 (0.79%) MySQL
Development Applications
1 13 (5.14%) Git
2 11 (4.35%) Jenkins
3 7 (2.77%) GitLab
4 6 (2.37%) JIRA
5 4 (1.58%) CircleCI
6 3 (1.19%) LoadRunner
7 2 (0.79%) Babel
7 2 (0.79%) Burp Suite
7 2 (0.79%) gulp
7 2 (0.79%) JMeter
7 2 (0.79%) NeoLoad
7 2 (0.79%) Oracle Forms
7 2 (0.79%) webpack
8 1 (0.40%) Artifactory
8 1 (0.40%) Atlassian Bamboo
8 1 (0.40%) Bitbucket
8 1 (0.40%) Octopus Deploy
8 1 (0.40%) SQL Server Management Studio (SSMS)
8 1 (0.40%) TeamCity
General
1 143 (56.52%) Social Skills
2 84 (33.20%) Analytical Skills
3 80 (31.62%) Finance
4 50 (19.76%) Law
5 38 (15.02%) Retail
6 19 (7.51%) Marketing
7 14 (5.53%) Public Sector
8 13 (5.14%) Legal
9 12 (4.74%) Billing
10 10 (3.95%) Banking
11 9 (3.56%) Games
12 7 (2.77%) Inclusion and Diversity
13 6 (2.37%) Documentation Skills
13 6 (2.37%) Manufacturing
13 6 (2.37%) Presentation Skills
14 5 (1.98%) Automotive
14 5 (1.98%) Organisational Skills
14 5 (1.98%) Pharmaceutical
14 5 (1.98%) Telecoms
15 4 (1.58%) Advertising
Job Titles
1 61 (24.11%) Senior
2 51 (20.16%) Analyst
3 33 (13.04%) Lead
4 31 (12.25%) Developer
5 13 (5.14%) Commercial Analyst
6 12 (4.74%) Insight Analyst
7 11 (4.35%) IT Manager
8 9 (3.56%) Consultant
8 9 (3.56%) Data Analyst
8 9 (3.56%) Senior Developer
9 8 (3.16%) Applications Support
9 8 (3.16%) Java Developer
9 8 (3.16%) Product Manager
9 8 (3.16%) Senior Analyst
9 8 (3.16%) Senior Java Developer
9 8 (3.16%) Site Engineer
9 8 (3.16%) Site Reliability Engineer
9 8 (3.16%) Support Analyst
10 7 (2.77%) Infrastructure Analyst
10 7 (2.77%) ServiceNow Developer
Libraries, Frameworks & Software Standards
1 18 (7.11%) CSS
1 18 (7.11%) HTML
2 16 (6.32%) XML
3 15 (5.93%) JSON
4 13 (5.14%) React
5 10 (3.95%) RESTful
6 8 (3.16%) .NET
6 8 (3.16%) Amazon Corretto
6 8 (3.16%) Django
6 8 (3.16%) REST
6 8 (3.16%) SOAP
7 6 (2.37%) Kafka
7 6 (2.37%) Middleware
7 6 (2.37%) Node.js
8 5 (1.98%) OAuth
9 4 (1.58%) gRPC
9 4 (1.58%) RabbitMQ
9 4 (1.58%) web3js
10 3 (1.19%) Oracle Fusion
10 3 (1.19%) Web Services
Miscellaneous
1 27 (10.67%) Analytical Mindset
2 21 (8.30%) Self-Motivation
3 17 (6.72%) Algorithms
4 14 (5.53%) Product Ownership
5 12 (4.74%) Cloud Native
5 12 (4.74%) Management Information System
6 10 (3.95%) e-Learning
7 8 (3.16%) Distributed Systems
8 7 (2.77%) Distributed Architecture
8 7 (2.77%) Social Media
9 5 (1.98%) SWIFT Messaging Network
10 4 (1.58%) Blockchain
10 4 (1.58%) Enterprise Software
10 4 (1.58%) FMCG
10 4 (1.58%) Onboarding
10 4 (1.58%) Public Cloud
10 4 (1.58%) Web3
11 3 (1.19%) Data Centre
11 3 (1.19%) Mobile App
11 3 (1.19%) Taxonomies
Operating Systems
1 31 (12.25%) Windows
2 22 (8.70%) Windows Server
3 19 (7.51%) Linux
4 8 (3.16%) Unix
5 5 (1.98%) Red Hat Enterprise Linux
6 3 (1.19%) Mac OS
6 3 (1.19%) VMS
7 2 (0.79%) Oracle Linux
7 2 (0.79%) Ubuntu
8 1 (0.40%) Android
8 1 (0.40%) Apple iOS
8 1 (0.40%) Windows Server 2012
8 1 (0.40%) Windows Server 2016
8 1 (0.40%) Windows Server 2019
Processes & Methodologies
1 109 (43.08%) Problem-Solving
2 83 (32.81%) Analytics
3 75 (29.64%) Agile
4 74 (29.25%) DevOps
5 60 (23.72%) Continuous Improvement
6 54 (21.34%) ITIL
7 43 (17.00%) Visualisation
8 42 (16.60%) Business Intelligence
9 41 (16.21%) CI/CD
10 40 (15.81%) AI
11 39 (15.42%) Roadmaps
12 38 (15.02%) Decision-Making
13 33 (13.04%) Infrastructure as Code
14 32 (12.65%) Change Management
14 32 (12.65%) Problem Management
15 30 (11.86%) Actionable Insight
16 29 (11.46%) Data Science
16 29 (11.46%) Product Management
17 28 (11.07%) Customer Service
17 28 (11.07%) Data Analysis
Programming Languages
1 58 (22.92%) SQL
2 39 (15.42%) Python
3 26 (10.28%) JavaScript
4 15 (5.93%) Data Analysis Expressions
4 15 (5.93%) Java
5 13 (5.14%) PowerShell
6 12 (4.74%) TypeScript
7 9 (3.56%) Bash
8 8 (3.16%) VBA
9 7 (2.77%) C#
10 5 (1.98%) Go
11 4 (1.58%) R
12 2 (0.79%) Groovy
13 1 (0.40%) Bicep
13 1 (0.40%) Kotlin
13 1 (0.40%) Objective-C
13 1 (0.40%) Perl
13 1 (0.40%) PL/SQL
13 1 (0.40%) Swift
13 1 (0.40%) VB.NET
Qualifications
1 71 (28.06%) Degree
2 23 (9.09%) Master's Degree
3 19 (7.51%) Security Cleared
4 16 (6.32%) Computer Science Degree
5 14 (5.53%) SC Cleared
6 10 (3.95%) ITIL Certification
7 9 (3.56%) Microsoft Certification
7 9 (3.56%) PMI Certification
7 9 (3.56%) PMP
8 7 (2.77%) Azure Certification
9 5 (1.98%) CSPO
9 5 (1.98%) HNC
9 5 (1.98%) HND
10 3 (1.19%) BPSS Clearance
10 3 (1.19%) CISA
10 3 (1.19%) CISM
10 3 (1.19%) CISSP
10 3 (1.19%) CRISC
10 3 (1.19%) ISO 27001 Lead Auditor
10 3 (1.19%) ITIL Foundation Certificate
Quality Assurance & Compliance
1 18 (7.11%) Data Quality
1 18 (7.11%) GDPR
2 16 (6.32%) QA
3 6 (2.37%) GRC
3 6 (2.37%) ISO/IEC 27001
4 5 (1.98%) ISO 20022
4 5 (1.98%) ISO 8583
4 5 (1.98%) SEPA
5 3 (1.19%) Accessibility
5 3 (1.19%) ISO 22301
5 3 (1.19%) ISO/IEC 27005
5 3 (1.19%) ISO/IEC 42001
5 3 (1.19%) PCI DSS
6 2 (0.79%) SLA
7 1 (0.40%) Actionable Recommendations
7 1 (0.40%) COBIT
7 1 (0.40%) Cyber Essentials
7 1 (0.40%) Cyber Essentials PLUS
7 1 (0.40%) HIPAA
7 1 (0.40%) SOC 2
System Software
1 27 (10.67%) Docker
2 11 (4.35%) Active Directory
3 3 (1.19%) Virtual Machines
3 3 (1.19%) VMware Infrastructure
4 2 (0.79%) Squid
4 2 (0.79%) VMware ESXi
Systems Management
1 29 (11.46%) Terraform
2 24 (9.49%) Kubernetes
3 13 (5.14%) Prometheus
4 11 (4.35%) Grafana
5 6 (2.37%) Ansible
6 4 (1.58%) Nagios
7 2 (0.79%) AssetCenter
7 2 (0.79%) EMC NetWorker
7 2 (0.79%) Kibana
7 2 (0.79%) Microsoft Intune
7 2 (0.79%) SCCM
7 2 (0.79%) Single Sign-On
8 1 (0.40%) Argo
8 1 (0.40%) Progress Chef
8 1 (0.40%) Puppet
Vendors
1 77 (30.43%) Microsoft
2 40 (15.81%) Google
3 17 (6.72%) ServiceNow
4 15 (5.93%) OpenAI
5 13 (5.14%) SAP
6 10 (3.95%) Oracle
7 9 (3.56%) SolarWinds
8 8 (3.16%) VMware
9 5 (1.98%) Cisco
9 5 (1.98%) Red Hat
10 4 (1.58%) Adobe
10 4 (1.58%) Databricks
10 4 (1.58%) Facebook
11 3 (1.19%) Instagram
12 2 (0.79%) CA Agile Central
12 2 (0.79%) Dynatrace
12 2 (0.79%) Liquidlogic
12 2 (0.79%) Rockwell
12 2 (0.79%) TikTok
12 2 (0.79%) Zerto