Educational Technology Jobs with Hybrid/Remote/WFH Options

Educational Technology (Edtech)
UK > Work from Home

The table below looks at the prevalence of the term Educational Technology in remote or hybrid work. Included is a benchmarking guide to the salaries offered in vacancies that cited Educational Technology over the 6 months leading up to 28 May 2025, comparing them to the same period in the previous two years.

6 months to
28 May 2025
Same period 2024 Same period 2023
Rank 432 550 570
Rank change year-on-year +118 +20 +156
Permanent jobs citing Educational Technology 41 44 75
As % of all permanent jobs with a WFH option 0.22% 0.13% 0.19%
As % of the Miscellaneous category 0.52% 0.36% 0.48%
Number of salaries quoted 33 37 67
10th Percentile - £37,500 £41,250
25th Percentile £25,000 £40,000 £55,000
Median annual salary (50th Percentile) £52,500 £50,000 £60,000
Median % change year-on-year +5.00% -16.67% -4.00%
75th Percentile £80,000 £72,500 £71,875
90th Percentile £92,500 £86,250 £78,750
UK median annual salary £57,500 £47,500 £60,000
% change year-on-year +21.05% -20.83% -4.00%

All Generic Skills
Work from Home

Educational Technology falls under the General and Transferable Skills category. For comparison with the information above, the following table provides summary statistics for all permanent job vacancies with remote or hybrid options requiring generic IT skills.

Permanent vacancies with a requirement for generic IT skills 7,862 12,098 15,476
As % of all permanent jobs with a WFH option 42.22% 35.39% 38.68%
Number of salaries quoted 3,562 9,252 11,284
10th Percentile £32,500 £32,500 £39,294
25th Percentile £46,813 £42,500 £48,750
Median annual salary (50th Percentile) £65,000 £59,526 £65,000
Median % change year-on-year +9.20% -8.42% -
75th Percentile £87,500 £80,000 £86,250
90th Percentile £122,500 £103,750 £110,000
UK median annual salary £60,000 £55,000 £65,000
% change year-on-year +9.09% -15.38% +4.00%

Educational Technology
Trend for Jobs with a WFH Option

Job vacancies with remote working options citing Educational Technology as a proportion of all IT jobs advertised.
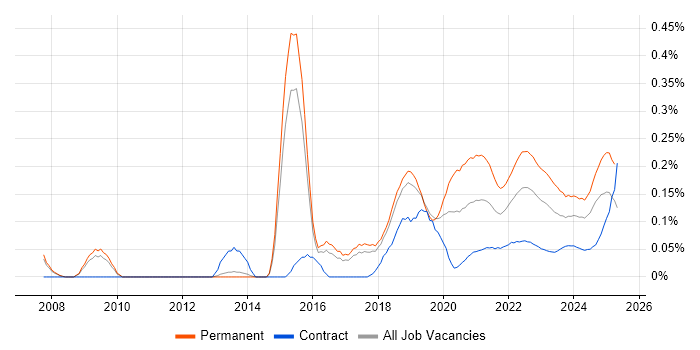
Educational Technology trend for jobs with Hybrid/Remote/WFH options

Educational Technology
Salary Trend for Jobs with a WFH Option

3-month moving average salary quoted in job vacancies with remote working options citing Educational Technology.

Educational Technology salary trend for jobs with a WFH option

Educational Technology
Salary Histogram for Jobs with a WFH Option

Salary distribution for jobs with remote working options citing Educational Technology over the 6 months to 28 May 2025.

Educational Technology salary histogram for jobs with a WFH option

Educational Technology
Co-occurring Skills and Capabilities with WFH Options by Category

The follow tables expand on the table above by listing co-occurrences grouped by category. The same employment type, locality and period is covered with up to 20 co-occurrences shown in each of the following categories:

Application Platforms
1 2 (4.88%) Apache Airflow
2 1 (2.44%) Confluence
Applications
1 3 (7.32%) Adobe Premiere
2 2 (4.88%) Adobe Captivate
2 2 (4.88%) Final Cut Pro
3 1 (2.44%) Microsoft Excel
3 1 (2.44%) Photoshop
Cloud Services
1 10 (24.39%) GitHub
2 8 (19.51%) Azure
3 7 (17.07%) AWS
4 6 (14.63%) Serverless
5 5 (12.20%) SaaS
6 3 (7.32%) Amazon EC2
6 3 (7.32%) Amazon S3
6 3 (7.32%) CloudFront
6 3 (7.32%) Power Platform
7 2 (4.88%) Azure Synapse Analytics
7 2 (4.88%) dbt
7 2 (4.88%) Snowflake
8 1 (2.44%) Adobe Creative Cloud
8 1 (2.44%) Azure Cosmos DB
8 1 (2.44%) Azure Functions
8 1 (2.44%) Azure Monitor
8 1 (2.44%) Azure Table
Database & Business Intelligence
1 6 (14.63%) Relational Database
2 5 (12.20%) SQL Server
3 3 (7.32%) Amazon RDS
3 3 (7.32%) Power BI
4 2 (4.88%) Metabase
4 2 (4.88%) Snowflake Schema
4 2 (4.88%) Tableau
5 1 (2.44%) Azure SQL Database
5 1 (2.44%) Elasticsearch
5 1 (2.44%) Mixpanel
Development Applications
1 6 (14.63%) Git
2 1 (2.44%) git-flow
2 1 (2.44%) JIRA
2 1 (2.44%) Subversion
General
1 16 (39.02%) Social Skills
2 10 (24.39%) Games
3 3 (7.32%) Analytical Skills
3 3 (7.32%) Finance
3 3 (7.32%) Inclusion and Diversity
3 3 (7.32%) Marketing
4 2 (4.88%) Multimedia
5 1 (2.44%) Advertising
5 1 (2.44%) Influencing Skills
5 1 (2.44%) Presentation Skills
5 1 (2.44%) Tech for Good
Job Titles
1 20 (48.78%) Developer
2 10 (24.39%) Android Developer
3 6 (14.63%) Front-End Developer (Client-Side Developer)
3 6 (14.63%) Senior
4 5 (12.20%) .NET Developer
4 5 (12.20%) React Developer
4 5 (12.20%) Software Engineer
5 2 (4.88%) Analyst
5 2 (4.88%) Architect
5 2 (4.88%) AWS Architect
5 2 (4.88%) Business Intelligence Developer
5 2 (4.88%) Full-Stack Engineer
5 2 (4.88%) Lead
5 2 (4.88%) Mobile Engineer
5 2 (4.88%) Senior Full-Stack Engineer
5 2 (4.88%) Senior Manager
5 2 (4.88%) Snowflake Developer
5 2 (4.88%) Technical Architect
6 1 (2.44%) Sales Administrator
6 1 (2.44%) Software Engineering Director
Libraries, Frameworks & Software Standards
1 11 (26.83%) React
2 10 (24.39%) HTML
3 9 (21.95%) CSS
4 8 (19.51%) .NET
5 7 (17.07%) .NET Core
6 5 (12.20%) Elastic Stack
7 4 (9.76%) Node.js
8 3 (7.32%) Laravel
8 3 (7.32%) OpenCV
8 3 (7.32%) PyTorch
8 3 (7.32%) TensorFlow
9 2 (4.88%) AngularJS
9 2 (4.88%) CSS3
9 2 (4.88%) EDI
9 2 (4.88%) HTML5
9 2 (4.88%) React Native
9 2 (4.88%) REST
9 2 (4.88%) RESTful
9 2 (4.88%) Vue
10 1 (2.44%) RxJS
Miscellaneous
1 10 (24.39%) Mobile Games
2 5 (12.20%) Mobile App
3 2 (4.88%) Client/Server
3 2 (4.88%) Learning Management System
4 1 (2.44%) Management Information System
4 1 (2.44%) Onboarding
4 1 (2.44%) Photography
4 1 (2.44%) Self-Motivation
4 1 (2.44%) Social Media
4 1 (2.44%) Video Editing
Operating Systems
1 12 (29.27%) Android
1 12 (29.27%) Apple iOS
2 10 (24.39%) Linux
Processes & Methodologies
1 20 (48.78%) Problem-Solving
2 19 (46.34%) DevOps
3 17 (41.46%) User Experience
4 14 (34.15%) Agile
5 12 (29.27%) Prototyping
6 11 (26.83%) Front End Development
7 10 (24.39%) Android Development
7 10 (24.39%) Deployment Automation
7 10 (24.39%) Game Development
7 10 (24.39%) Rapid Prototyping
7 10 (24.39%) Software Engineering
8 7 (17.07%) API Development
8 7 (17.07%) Continuous Improvement
8 7 (17.07%) Microservices
8 7 (17.07%) Test Automation
9 6 (14.63%) Computer Science
10 5 (12.20%) Backlog Prioritisation
10 5 (12.20%) Build Automation
10 5 (12.20%) Full-Stack Development
10 5 (12.20%) Project Delivery
Programming Languages
1 15 (36.59%) JavaScript
2 12 (29.27%) Java
3 10 (24.39%) Kotlin
3 10 (24.39%) Objective-C
3 10 (24.39%) SQL
3 10 (24.39%) Swift
4 8 (19.51%) C#
5 5 (12.20%) TypeScript
6 3 (7.32%) PHP
Qualifications
1 8 (19.51%) Degree
2 6 (14.63%) Computer Science Degree
3 2 (4.88%) Master's Degree
3 2 (4.88%) Postgraduate
4 1 (2.44%) ITIL Foundation Certificate
Quality Assurance & Compliance
1 17 (41.46%) QA
2 5 (12.20%) Accessibility
System Software
1 6 (14.63%) Docker
Systems Management
1 6 (14.63%) Kubernetes
2 1 (2.44%) Grafana
2 1 (2.44%) Prometheus
Vendors
1 5 (12.20%) Microsoft
2 4 (9.76%) Salesforce
3 3 (7.32%) Adobe
4 2 (4.88%) HubSpot
4 2 (4.88%) Oracle
5 1 (2.44%) Amplitude
5 1 (2.44%) Facebook
5 1 (2.44%) Google
5 1 (2.44%) Instagram
5 1 (2.44%) Pardot
5 1 (2.44%) TikTok
5 1 (2.44%) Twitter