Self-Motivation Contracts in London

Self-Motivation
England > London

The table below looks at the prevalence of the term Self-Motivation in contract job vacancies in London. Included is a benchmarking guide to the contractor rates offered in vacancies that cited Self-Motivation over the 6 months leading up to 14 August 2025, comparing them to the same period in the previous two years.

6 months to
14 Aug 2025
Same period 2024 Same period 2023
Rank 207 199 196
Rank change year-on-year -8 -3 +6
Contract jobs citing Self-Motivation 170 206 325
As % of all contract jobs advertised in London 1.26% 1.27% 1.37%
As % of the Miscellaneous category 3.34% 3.78% 3.90%
Number of daily rates quoted 111 139 219
10th Percentile £319 £300 £300
25th Percentile £408 £400 £410
Median daily rate (50th Percentile) £500 £500 £568
Median % change year-on-year - -11.89% +3.18%
75th Percentile £594 £638 £650
90th Percentile £700 £830 £792
England median daily rate £475 £475 £534
% change year-on-year - -11.05% +1.71%
Number of hourly rates quoted 12 7 5
10th Percentile £14.41 £14.10 £22.90
25th Percentile - £25.79 £27.25
Median hourly rate £15.84 £50.00 £41.50
Median % change year-on-year -68.32% +20.48% +90.80%
75th Percentile - £65.02 £52.97
90th Percentile £29.48 £65.82 £62.44
England median hourly rate £21.39 £65.00 £44.91
% change year-on-year -67.09% +44.73% +38.18%

All Generic Skills
London

Self-Motivation falls under the General and Transferable Skills category. For comparison with the information above, the following table provides summary statistics for all contract job vacancies requiring generic IT skills in London.

Contract vacancies with a requirement for generic IT skills 5,089 5,445 8,340
As % of all contract IT jobs advertised in London 37.62% 33.59% 35.28%
Number of daily rates quoted 3,346 3,791 6,075
10th Percentile £332 £325 £357
25th Percentile £438 £456 £488
Median daily rate (50th Percentile) £575 £575 £600
Median % change year-on-year - -4.17% -
75th Percentile £720 £750 £738
90th Percentile £825 £863 £838
England median daily rate £525 £550 £550
% change year-on-year -4.55% - -
Number of hourly rates quoted 120 83 78
10th Percentile £15.84 £16.37 £17.79
25th Percentile £22.50 £22.00 £23.31
Median hourly rate £27.50 £30.12 £34.81
Median % change year-on-year -8.70% -13.47% +3.69%
75th Percentile £46.00 £53.75 £58.44
90th Percentile £65.06 £71.25 £78.25
England median hourly rate £30.75 £48.75 £42.00
% change year-on-year -36.92% +16.07% +61.54%

Self-Motivation
Job Vacancy Trend in London

Job postings citing Self-Motivation as a proportion of all IT jobs advertised in London.
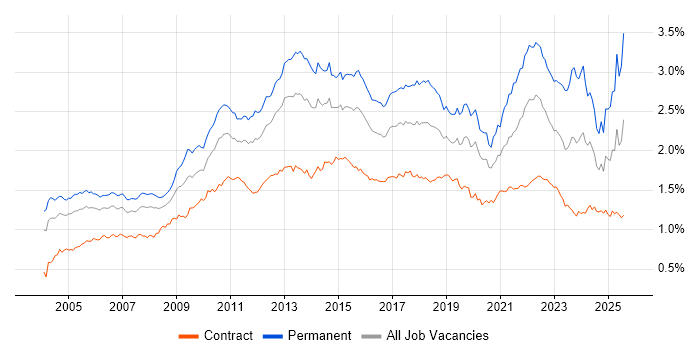
Job vacancy trend for Self-Motivation in London

Self-Motivation
Contractor Daily Rate Trend in London

3-month moving average daily rate quoted in jobs citing Self-Motivation in London.

Daily rate trend for Self-Motivation in London

Self-Motivation
Daily Rate Histogram in London

Daily rate distribution for jobs citing Self-Motivation in London over the 6 months to 14 August 2025.

Daily rate histogram for Self-Motivation in London

Self-Motivation
Contractor Hourly Rate Trend in London

3-month moving average hourly rates quoted in jobs citing Self-Motivation in London.

Hourly rate trend for Self-Motivation in London

Self-Motivation
Hourly Rate Histogram in London

Hourly rate distribution of jobs citing Self-Motivation in London over the 6 months to 14 August 2025.

Hourly rate histogram for Self-Motivation in London

Self-Motivation
Contract Job Locations in London

The table below looks at the demand and provides a guide to the median contractor rates quoted in IT jobs citing Self-Motivation within the London region over the 6 months to 14 August 2025. The 'Rank Change' column provides an indication of the change in demand within each location based on the same 6 month period last year.

Location Rank Change
on Same Period
Last Year
Matching
Contract
IT Job Ads
Median
Daily Rate
Past 6 Months
Median Daily Rate
% Change
on Same Period
Last Year
Live
Jobs
Central London +4 23 £563 -5.46% 48
South London +7 11 £500 -28.57% 21
West London -4 3 £750 +30.43% 16
East London +9 2 £308 +2.50% 6
Self-Motivation
England

Self-Motivation
Co-occurring Skills and Capabilities in London by Category

The follow tables expand on the table above by listing co-occurrences grouped by category. The same employment type, locality and period is covered with up to 20 co-occurrences shown in each of the following categories:

Application Platforms
1 9 (5.29%) SharePoint
2 4 (2.35%) Apache Spark
2 4 (2.35%) Confluence
2 4 (2.35%) IIS
3 3 (1.76%) Microsoft Exchange
3 3 (1.76%) SharePoint 2010
4 2 (1.18%) Jupyter
5 1 (0.59%) Apache
5 1 (0.59%) Appian
5 1 (0.59%) Camunda
5 1 (0.59%) JBoss
5 1 (0.59%) nginx
5 1 (0.59%) Oracle SOA Suite
5 1 (0.59%) Oracle Workflow
Applications
1 31 (18.24%) Microsoft Excel
2 26 (15.29%) Microsoft Office
3 10 (5.88%) Microsoft PowerPoint
4 3 (1.76%) InfoPath
4 3 (1.76%) MS Visio
5 2 (1.18%) Adobe After Effects
5 2 (1.18%) Adobe Illustrator
5 2 (1.18%) Photoshop
6 1 (0.59%) Microsoft Project
6 1 (0.59%) Spreadsheet
Business Applications
1 2 (1.18%) Dynamics NAV
1 2 (1.18%) SAP MM
1 2 (1.18%) Temenos T24
2 1 (0.59%) Actimize
2 1 (0.59%) OpenText MBPM
2 1 (0.59%) Oracle BPM
2 1 (0.59%) Payment Gateway
2 1 (0.59%) Salesforce CRM
2 1 (0.59%) SAP Oil and Gas
2 1 (0.59%) SAP S/4HANA
2 1 (0.59%) Workday HCM
Cloud Services
1 34 (20.00%) Azure
2 26 (15.29%) AWS
3 17 (10.00%) Power Platform
4 12 (7.06%) GCP
5 8 (4.71%) Entra ID
6 7 (4.12%) Microsoft 365
7 6 (3.53%) dbt
7 6 (3.53%) Power Automate
7 6 (3.53%) PowerApps
8 5 (2.94%) GitHub
9 4 (2.35%) Azure DevOps
9 4 (2.35%) Cloud Computing
9 4 (2.35%) Dropbox
10 3 (1.76%) Dynamics 365
10 3 (1.76%) Google Ads
10 3 (1.76%) OneDrive
10 3 (1.76%) SaaS
10 3 (1.76%) ShareGate
11 2 (1.18%) AWS Data Pipeline
11 2 (1.18%) PaaS
Communications & Networking
1 11 (6.47%) Firewall
2 9 (5.29%) LAN
3 8 (4.71%) DHCP
3 8 (4.71%) DNS
3 8 (4.71%) Network Security
3 8 (4.71%) TCP/IP
3 8 (4.71%) VPN
3 8 (4.71%) WAN
4 7 (4.12%) Wireless
5 6 (3.53%) 4G
6 2 (1.18%) Intrusion Detection
6 2 (1.18%) RTP
6 2 (1.18%) Wi-Fi
7 1 (0.59%) Multicast
7 1 (0.59%) SAN
7 1 (0.59%) WebEx
Database & Business Intelligence
1 14 (8.24%) Power BI
2 9 (5.29%) Big Data
2 9 (5.29%) Tableau
3 8 (4.71%) Geospatial Data
3 8 (4.71%) GIS
4 6 (3.53%) SQL Server
5 4 (2.35%) Data Lake
5 4 (2.35%) Metadata
5 4 (2.35%) Qlik Sense
5 4 (2.35%) Spotfire
6 3 (1.76%) Data Warehouse
6 3 (1.76%) QGIS
7 2 (1.18%) Apache Hive
7 2 (1.18%) Azure SQL Database
7 2 (1.18%) Data Mart
7 2 (1.18%) Hadoop
7 2 (1.18%) Impala
7 2 (1.18%) MongoDB
7 2 (1.18%) MySQL
7 2 (1.18%) NoSQL
Development Applications
1 11 (6.47%) Git
2 8 (4.71%) JIRA
3 3 (1.76%) Postman
4 2 (1.18%) SonarQube
4 2 (1.18%) Xcode
5 1 (0.59%) Artifactory
5 1 (0.59%) CMake
5 1 (0.59%) GitLab
5 1 (0.59%) IntelliJ
5 1 (0.59%) Jenkins
5 1 (0.59%) JMeter
5 1 (0.59%) JUnit
5 1 (0.59%) Mockito
5 1 (0.59%) MSI
5 1 (0.59%) Subversion
General
1 111 (65.29%) Social Skills
2 57 (33.53%) Analytical Skills
3 51 (30.00%) Finance
4 35 (20.59%) Banking
5 23 (13.53%) Organisational Skills
6 18 (10.59%) Presentation Skills
7 12 (7.06%) Financial Institution
7 12 (7.06%) Investment Banking
8 10 (5.88%) Marketing
9 8 (4.71%) Telecoms
10 7 (4.12%) Back Office
11 6 (3.53%) Inclusion and Diversity
11 6 (3.53%) Influencing Skills
12 4 (2.35%) Billing
12 4 (2.35%) Legal
13 3 (1.76%) Advertising
13 3 (1.76%) French Language
13 3 (1.76%) Retail
13 3 (1.76%) Retail Banking
14 2 (1.18%) Publishing
Job Titles
1 31 (18.24%) Analyst
2 25 (14.71%) Senior
3 13 (7.65%) Developer
4 12 (7.06%) Business Analyst
5 9 (5.29%) Architect
6 8 (4.71%) Data Engineer
7 7 (4.12%) Data Analyst
7 7 (4.12%) Senior Analyst
7 7 (4.12%) Software Engineer
8 6 (3.53%) Infrastructure Engineer
8 6 (3.53%) Scrum Master
8 6 (3.53%) Senior Infrastructure Engineer
9 5 (2.94%) Java Engineer
9 5 (2.94%) Lead
10 4 (2.35%) Consultant
10 4 (2.35%) Designer
10 4 (2.35%) Java Developer
10 4 (2.35%) Python Engineer
10 4 (2.35%) Senior Developer
10 4 (2.35%) Solutions Architect
Libraries, Frameworks & Software Standards
1 12 (7.06%) REST
2 9 (5.29%) Smart Contracts
3 8 (4.71%) .NET
4 5 (2.94%) .NET Framework
5 4 (2.35%) RESTful
6 3 (1.76%) GeoPandas
6 3 (1.76%) OpenAPI
6 3 (1.76%) PostGIS
6 3 (1.76%) React
6 3 (1.76%) Swagger
6 3 (1.76%) Web Services
7 2 (1.18%) ASP.NET
7 2 (1.18%) EDI
7 2 (1.18%) Flutter
7 2 (1.18%) GraphQL
7 2 (1.18%) Hugging Face
7 2 (1.18%) Keras
7 2 (1.18%) Middleware
7 2 (1.18%) PyTorch
7 2 (1.18%) TensorFlow
Miscellaneous
1 12 (7.06%) Product Ownership
2 9 (5.29%) Blockchain
3 6 (3.53%) Security Operations Centre
3 6 (3.53%) Virtual Team
4 5 (2.94%) Equities
5 4 (2.35%) Foreign Exchange (FX)
5 4 (2.35%) Onboarding
6 3 (1.76%) Algorithms
6 3 (1.76%) Cloud Native
6 3 (1.76%) Data Protection Act
6 3 (1.76%) Distributed Computing
6 3 (1.76%) Enterprise Software
6 3 (1.76%) Market Risk
6 3 (1.76%) Mobile App
6 3 (1.76%) Security Posture
7 2 (1.18%) Credit Risk
7 2 (1.18%) Management Information System
7 2 (1.18%) PKI
7 2 (1.18%) Reinsurance
7 2 (1.18%) SWIFT Messaging Network
Operating Systems
1 22 (12.94%) Windows
2 7 (4.12%) Linux
2 7 (4.12%) Windows Server
3 3 (1.76%) Apple iOS
4 2 (1.18%) Android
4 2 (1.18%) Red Hat Enterprise Linux
4 2 (1.18%) Windows 10
5 1 (0.59%) Mac OS
5 1 (0.59%) tvOS
5 1 (0.59%) watchOS
5 1 (0.59%) Windows 7
5 1 (0.59%) Windows Server 2019
Processes & Methodologies
1 52 (30.59%) Problem-Solving
2 39 (22.94%) Agile
3 34 (20.00%) Analytics
4 27 (15.88%) Time Management
5 24 (14.12%) Continuous Improvement
5 24 (14.12%) Decision-Making
6 21 (12.35%) Project Management
7 17 (10.00%) Business Strategy
8 16 (9.41%) Asset Management
8 16 (9.41%) Business Intelligence
8 16 (9.41%) DevOps
8 16 (9.41%) SDLC
9 15 (8.82%) CI/CD
9 15 (8.82%) Customer Service
9 15 (8.82%) Visualisation
10 14 (8.24%) Roadmaps
11 13 (7.65%) Data Visualisation
11 13 (7.65%) Software Engineering
12 12 (7.06%) Mentoring
12 12 (7.06%) User Experience
Programming Languages
1 32 (18.82%) Python
1 32 (18.82%) SQL
2 15 (8.82%) Java
3 14 (8.24%) JavaScript
4 9 (5.29%) DAML
5 6 (3.53%) PowerShell
6 5 (2.94%) C#
7 3 (1.76%) R
8 2 (1.18%) Dart
8 2 (1.18%) Data Analysis Expressions
8 2 (1.18%) Objective-C
8 2 (1.18%) PHP
8 2 (1.18%) PL/SQL
8 2 (1.18%) Swift
8 2 (1.18%) T-SQL
8 2 (1.18%) VB
9 1 (0.59%) C
9 1 (0.59%) C++
9 1 (0.59%) Korn
9 1 (0.59%) Ruby
Qualifications
1 25 (14.71%) Degree
2 10 (5.88%) Cisco Certification
3 9 (5.29%) Security Cleared
4 7 (4.12%) CCNA
5 6 (3.53%) SC Cleared
6 5 (2.94%) CCNP
7 3 (1.76%) (ISC)2 CCSP
7 3 (1.76%) Azure Certification
7 3 (1.76%) CISSP
7 3 (1.76%) Computer Science Degree
7 3 (1.76%) DV Cleared
7 3 (1.76%) EMC Certification
7 3 (1.76%) GCIH
7 3 (1.76%) HNC
7 3 (1.76%) HND
8 2 (1.18%) CIPD
8 2 (1.18%) Master's Degree
8 2 (1.18%) PMI Certification
8 2 (1.18%) PMP
8 2 (1.18%) TOGAF Certification
Quality Assurance & Compliance
1 7 (4.12%) QA
2 4 (2.35%) Accessibility
3 3 (1.76%) Def Stans
3 3 (1.76%) IEC 61508
3 3 (1.76%) ISO 20022
3 3 (1.76%) ISO/IEC 15288
3 3 (1.76%) NIST
3 3 (1.76%) SLA
4 2 (1.18%) Government Security Classifications
4 2 (1.18%) HMG Security Policy Framework
4 2 (1.18%) ISO/IEC 27001
4 2 (1.18%) PMO
4 2 (1.18%) PSD2
4 2 (1.18%) SEPA
5 1 (0.59%) COBIT
5 1 (0.59%) EMIR
5 1 (0.59%) GDPR
5 1 (0.59%) ISO 15022
5 1 (0.59%) MiFID
5 1 (0.59%) Sarbanes-Oxley
System Software
1 10 (5.88%) Active Directory
2 5 (2.94%) Docker
3 2 (1.18%) VMware Infrastructure
Systems Management
1 7 (4.12%) FortiGate
2 4 (2.35%) Terraform
3 3 (1.76%) Functional Safety
4 2 (1.18%) Ansible
4 2 (1.18%) Kubernetes
5 1 (0.59%) Argo
5 1 (0.59%) Grafana
5 1 (0.59%) ITRS Geneos
5 1 (0.59%) Jamf Pro
5 1 (0.59%) Microsoft Intune
5 1 (0.59%) Prometheus
5 1 (0.59%) SCCM
5 1 (0.59%) Single Sign-On
5 1 (0.59%) ZABBIX
Vendors
1 39 (22.94%) Microsoft
2 10 (5.88%) Databricks
3 9 (5.29%) SAP
4 8 (4.71%) Oracle
5 7 (4.12%) Google
6 5 (2.94%) Salesforce
7 3 (1.76%) Adobe
7 3 (1.76%) Cisco
7 3 (1.76%) EMC
8 2 (1.18%) Apple
8 2 (1.18%) CA Agile Central
8 2 (1.18%) DocuSign
8 2 (1.18%) Facebook
8 2 (1.18%) Instagram
8 2 (1.18%) OpenAI
8 2 (1.18%) Red Hat
8 2 (1.18%) ServiceNow
8 2 (1.18%) VMware
8 2 (1.18%) Workday
9 1 (0.59%) YouTube