ITSM Contract Job Trends in London

IT Service Management (ITSM)
England > London

The table below provides summary statistics and contractor rates for jobs advertised in London requiring ITSM skills. It covers contract job vacancies from the 6 months leading up to 2 November 2025, with comparisons to the same periods in the previous two years.

6 months to
2 Nov 2025
Same period 2024 Same period 2023
Rank 148 114 148
Rank change year-on-year -34 +34 +51
Contract jobs citing ITSM 250 347 346
As % of all contract jobs in London 1.84% 2.22% 1.70%
As % of the Processes & Methodologies category 1.99% 2.49% 1.89%
Number of daily rates quoted 160 182 249
10th Percentile £190 £226 £207
25th Percentile £313 £350 £400
Median daily rate (50th Percentile) £475 £495 £540
Median % change year-on-year -4.04% -8.33% -
75th Percentile £604 £584 £625
90th Percentile £713 £663 £690
England median daily rate £487 £489 £525
% change year-on-year -0.46% -6.90% +7.14%
Number of hourly rates quoted 2 5 2
10th Percentile £31.14 £19.10 £27.12
25th Percentile £40.11 £20.00 £34.06
Median hourly rate £57.58 £26.50 £47.50
Median % change year-on-year +117.26% -44.20% +156.73%
75th Percentile £77.54 £68.00 £62.81
90th Percentile £88.02 £87.20 £70.87
England median hourly rate £20.79 £20.00 £14.50
% change year-on-year +3.95% +37.93% -

All Process and Methodology Skills
London

ITSM falls under the Processes and Methodologies category. For comparison with the information above, the following table provides summary statistics for all contract job vacancies requiring process or methodology skills in London.

Contract vacancies with a requirement for process or methodology skills 12,561 13,945 18,270
As % of all contract IT jobs advertised in London 92.42% 89.18% 89.71%
Number of daily rates quoted 8,256 8,980 13,172
10th Percentile £331 £350 £363
25th Percentile £425 £450 £463
Median daily rate (50th Percentile) £538 £550 £575
Median % change year-on-year -2.27% -4.35% -2.13%
75th Percentile £663 £675 £688
90th Percentile £775 £800 £800
England median daily rate £508 £525 £550
% change year-on-year -3.33% -4.55% -
Number of hourly rates quoted 249 168 236
10th Percentile £17.98 £17.43 £18.42
25th Percentile £25.04 £25.17 £21.44
Median hourly rate £30.50 £38.75 £39.09
Median % change year-on-year -21.29% -0.86% +4.23%
75th Percentile £47.50 £58.75 £63.75
90th Percentile £65.00 £80.23 £77.50
England median hourly rate £25.15 £39.00 £44.50
% change year-on-year -35.51% -12.36% +27.14%

ITSM
Job Vacancy Trend in London

Historical trend showing the proportion of contract IT job postings citing ITSM relative to all contract IT jobs advertised in London.
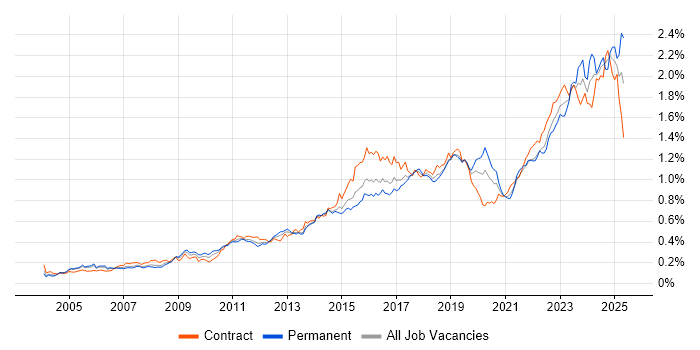
ITSM job vacancy trend in London

ITSM
Daily Rate Trend in London

Contractor daily rate distribution trend for jobs in London citing ITSM.

Contractor daily rate distribution trend for jobs in London citing ITSM

ITSM
Daily Rate Histogram in London

Daily rate distribution for jobs citing ITSM in London over the 6 months to 2 November 2025.

Daily rate histogram for ITSM in London

ITSM
Hourly Rate Trend in London

Contractor hourly rate distribution trend for jobs in London citing ITSM.

Contractor hourly rate distribution trend for jobs in London citing ITSM

ITSM
Hourly Rate Histogram in London

Hourly rate distribution of jobs citing ITSM in London over the 6 months to 2 November 2025.

Hourly rate histogram for ITSM in London

ITSM
Contract Job Locations in London

The table below looks at the demand and provides a guide to the median contractor rates quoted in IT jobs citing ITSM within the London region over the 6 months to 2 November 2025. The 'Rank Change' column provides an indication of the change in demand within each location based on the same 6 month period last year.

Location Rank Change
on Same Period
Last Year
Matching
Contract
IT Job Ads
Median
Daily Rate
Past 6 Months
Median Daily Rate
% Change
on Same Period
Last Year
Live
Jobs
Central London -11 39 £500 +5.26% 31
South London -7 12 £463 +72.90%
West London -7 6 £250 -55.75% 5
East London +1 2 £675 +42.11% 2
ITSM
England

ITSM
Co-Occurring Skills & Capabilities in London by Category

The following tables expand on the one above by listing co-occurrences grouped by category. They cover the same employment type, locality and period, with up to 20 co-occurrences shown in each category:

Application Platforms
1 20 (8.00%) SharePoint
2 15 (6.00%) Confluence
3 12 (4.80%) Microsoft Exchange
4 2 (0.80%) WebLogic
4 2 (0.80%) WebSphere
4 2 (0.80%) WildFly
5 1 (0.40%) Apache Solr
5 1 (0.40%) Skype for Business
Applications
1 23 (9.20%) Microsoft Office
2 12 (4.80%) Microsoft Excel
3 6 (2.40%) Microsoft PowerPoint
4 4 (1.60%) Autodesk Inventor
5 3 (1.20%) MS Visio
6 2 (0.80%) Spreadsheet
7 1 (0.40%) Adobe Creative Suite
7 1 (0.40%) Chatbot
Business Applications
1 41 (16.40%) Remedy ITSM
2 5 (2.00%) SAP S/4HANA
3 4 (1.60%) Salesforce CRM
3 4 (1.60%) Workday HCM
4 3 (1.20%) Dynamics CRM
5 1 (0.40%) Cloudability
5 1 (0.40%) NetSuite
5 1 (0.40%) Oracle HRMS
5 1 (0.40%) ResourceLink
Cloud Services
1 65 (26.00%) Azure
2 50 (20.00%) Microsoft 365
3 30 (12.00%) Azure DevOps
4 17 (6.80%) AWS
5 15 (6.00%) Entra ID
5 15 (6.00%) OneDrive
6 14 (5.60%) Power Platform
7 11 (4.40%) SaaS
8 6 (2.40%) Dynamics 365
9 5 (2.00%) Azure Sentinel
9 5 (2.00%) PaaS
9 5 (2.00%) PowerApps
10 4 (1.60%) Azure Logic Apps
10 4 (1.60%) GCP
10 4 (1.60%) Microsoft Copilot
10 4 (1.60%) Power Automate
11 3 (1.20%) Azure Functions
11 3 (1.20%) Azure Monitor
11 3 (1.20%) Serverless
12 2 (0.80%) Azure Service Bus
Communications & Networking
1 15 (6.00%) DNS
1 15 (6.00%) VPN
2 13 (5.20%) SSL
3 12 (4.80%) DHCP
4 11 (4.40%) TCP/IP
5 8 (3.20%) Firewall
6 7 (2.80%) Remote Desktop
7 5 (2.00%) WAN
8 4 (1.60%) LAN
8 4 (1.60%) Wi-Fi
9 3 (1.20%) NetScaler
9 3 (1.20%) Wireless
10 2 (0.80%) Cisco Wireless
10 2 (0.80%) NAS
10 2 (0.80%) Network Security
10 2 (0.80%) SAN
10 2 (0.80%) SSH
11 1 (0.40%) Intrusion Detection
11 1 (0.40%) VLAN
11 1 (0.40%) Wireshark
Database & Business Intelligence
1 11 (4.40%) Power BI
2 3 (1.20%) SQL Server
2 3 (1.20%) Tableau
3 2 (0.80%) SQL Server Integration Services
3 2 (0.80%) SQL Server Reporting Services
4 1 (0.40%) Amazon Redshift
4 1 (0.40%) Elasticsearch
4 1 (0.40%) GIS
4 1 (0.40%) MySQL
4 1 (0.40%) Pentaho
4 1 (0.40%) Relational Database
Development Applications
1 50 (20.00%) JIRA
2 3 (1.20%) Git
3 2 (0.80%) Jenkins
3 2 (0.80%) Octopus Deploy
3 2 (0.80%) TeamCity
4 1 (0.40%) Bitbucket
4 1 (0.40%) Metasploit
4 1 (0.40%) ScriptRunner
4 1 (0.40%) Zephyr
General
1 98 (39.20%) Social Skills
2 56 (22.40%) Finance
3 30 (12.00%) Analytical Skills
4 19 (7.60%) Public Sector
5 9 (3.60%) Banking
6 8 (3.20%) Inclusion and Diversity
7 7 (2.80%) Legal
7 7 (2.80%) Presentation Skills
8 6 (2.40%) Influencing Skills
8 6 (2.40%) Retail
8 6 (2.40%) Telecoms
9 4 (1.60%) Documentation Skills
9 4 (1.60%) Local Government
9 4 (1.60%) Military
10 3 (1.20%) Back Office
10 3 (1.20%) Marketing
11 2 (0.80%) Automotive
12 1 (0.40%) Billing
12 1 (0.40%) Games
12 1 (0.40%) Law
Job Titles
1 38 (15.20%) Analyst
2 35 (14.00%) Architect
3 34 (13.60%) Developer
4 29 (11.60%) Lead
4 29 (11.60%) Support Engineer
5 27 (10.80%) ServiceNow Developer
6 21 (8.40%) ServiceNow Architect
7 19 (7.60%) Consultant
8 16 (6.40%) Senior
9 14 (5.60%) IT Support
10 13 (5.20%) IT Engineer
10 13 (5.20%) Support Analyst
11 12 (4.80%) Business Analyst
11 12 (4.80%) Service Analyst
12 10 (4.00%) Desktop Support
12 10 (4.00%) IT Support Engineer
12 10 (4.00%) Service Manager
13 9 (3.60%) Desktop Engineer
13 9 (3.60%) Desktop Support Engineer
13 9 (3.60%) Operations Analyst
Libraries, Frameworks & Software Standards
1 45 (18.00%) REST
2 44 (17.60%) SOAP
3 21 (8.40%) Web Services
4 17 (6.80%) AngularJS
4 17 (6.80%) HTML
5 13 (5.20%) jQuery
5 13 (5.20%) JSON
5 13 (5.20%) SAML
6 12 (4.80%) Apache Camel
6 12 (4.80%) HTML5
6 12 (4.80%) JDBC
6 12 (4.80%) LDAP
6 12 (4.80%) ODBC
6 12 (4.80%) RabbitMQ
7 7 (2.80%) .NET
8 6 (2.40%) RESTful
9 5 (2.00%) CSS
9 5 (2.00%) Lightning Web Components
10 2 (0.80%) EDI
10 2 (0.80%) XML
Miscellaneous
1 47 (18.80%) CMDB
2 14 (5.60%) Onboarding
3 7 (2.80%) Management Information System
4 6 (2.40%) Data Protection Act
5 5 (2.00%) Cyber Kill Chain
5 5 (2.00%) Data Centre
5 5 (2.00%) Product Ownership
6 4 (1.60%) Greenfield Project
6 4 (1.60%) Video Conferencing
7 3 (1.20%) Cloud Native
7 3 (1.20%) Replication
8 2 (0.80%) Enterprise Software
8 2 (0.80%) Low-Code
8 2 (0.80%) Public Cloud
8 2 (0.80%) Reference Data
8 2 (0.80%) Reinsurance
8 2 (0.80%) Video\Live Streaming
8 2 (0.80%) Virtual Team
9 1 (0.40%) Mobile App
9 1 (0.40%) Over-the-Top Content
Operating Systems
1 62 (24.80%) Windows
2 24 (9.60%) Windows 10
3 10 (4.00%) Apple iOS
4 7 (2.80%) Android
4 7 (2.80%) Mac OS
5 6 (2.40%) Linux
6 4 (1.60%) Windows Server
7 3 (1.20%) Mac OS X
7 3 (1.20%) Unix
8 1 (0.40%) CentOS
8 1 (0.40%) Red Hat Enterprise Linux
8 1 (0.40%) Ubuntu
8 1 (0.40%) VMS
Processes & Methodologies
1 101 (40.40%) Service Management
2 99 (39.60%) ITIL
3 67 (26.80%) Agile
4 58 (23.20%) Problem-Solving
5 54 (21.60%) DevOps
6 42 (16.80%) Scrum
7 40 (16.00%) Service Delivery
8 39 (15.60%) Stakeholder Engagement
9 34 (13.60%) Stakeholder Management
10 32 (12.80%) Continuous Improvement
11 30 (12.00%) Change Management
11 30 (12.00%) Customer Service
12 27 (10.80%) Data Protection
13 24 (9.60%) Analytics
14 23 (9.20%) Configuration Management
15 22 (8.80%) Workflow
16 20 (8.00%) Dashboard Development
16 20 (8.00%) Roadmaps
17 19 (7.60%) Requirements Gathering
17 19 (7.60%) User Experience
Programming Languages
1 48 (19.20%) JavaScript
2 21 (8.40%) PowerShell
3 16 (6.40%) SQL
4 13 (5.20%) Python
5 6 (2.40%) Kusto Query Language
6 5 (2.00%) C#
7 4 (1.60%) Bash
8 3 (1.20%) Bicep
9 2 (0.80%) ActionScript
9 2 (0.80%) ActionScript 2.0
9 2 (0.80%) Java
9 2 (0.80%) Perl
10 1 (0.40%) Groovy
10 1 (0.40%) R
10 1 (0.40%) Ruby
10 1 (0.40%) TypeScript
Qualifications
1 53 (21.20%) Security Cleared
2 47 (18.80%) SC Cleared
3 24 (9.60%) Degree
4 19 (7.60%) ITIL Certification
5 5 (2.00%) A+ Certification
5 5 (2.00%) CompTIA Security+
6 3 (1.20%) Cisco Certification
7 2 (0.80%) AWS Certification
7 2 (0.80%) Azure Certification
7 2 (0.80%) CCNA
7 2 (0.80%) CCNP
7 2 (0.80%) DBS Check
7 2 (0.80%) DV Cleared
7 2 (0.80%) PMP
8 1 (0.40%) AWS Certified Solutions Architect
8 1 (0.40%) BPSS Clearance
8 1 (0.40%) CISSP
8 1 (0.40%) CompTIA CySA+
8 1 (0.40%) ITIL Foundation Certificate
8 1 (0.40%) VCAP
Quality Assurance & Compliance
1 11 (4.40%) QA
2 9 (3.60%) SLA
3 8 (3.20%) GDPR
4 6 (2.40%) COBIT
4 6 (2.40%) ISO/IEC 27001
5 4 (1.60%) GRC
5 4 (1.60%) NIST
6 3 (1.20%) Data Quality
6 3 (1.20%) ISO/IEC 19770
7 2 (0.80%) Accessibility
7 2 (0.80%) Sarbanes-Oxley
8 1 (0.40%) Actionable Recommendations
8 1 (0.40%) Cyber Essentials
8 1 (0.40%) Cyber Essentials PLUS
8 1 (0.40%) GxP
8 1 (0.40%) ISO 9001
8 1 (0.40%) ISO/IEC 20000
8 1 (0.40%) PCI DSS
8 1 (0.40%) SOC 2
System Software
1 50 (20.00%) Active Directory
2 5 (2.00%) VMware Infrastructure
3 4 (1.60%) Hyper-V
3 4 (1.60%) vSphere
4 3 (1.20%) Virtual Desktop
5 2 (0.80%) VMware ESXi
6 1 (0.40%) BitLocker
6 1 (0.40%) Virtual Machines
Systems Management
1 17 (6.80%) Microsoft Intune
2 15 (6.00%) Single Sign-On
3 12 (4.80%) SCCM
4 9 (3.60%) SCOM
5 8 (3.20%) HP SiteScope
6 5 (2.00%) Jamf Pro
6 5 (2.00%) Terraform
7 3 (1.20%) Ansible
8 2 (0.80%) HP ALM
8 2 (0.80%) Kubernetes
9 1 (0.40%) FortiGate
9 1 (0.40%) HP Operations Orchestration
9 1 (0.40%) Nessus
9 1 (0.40%) Opsgenie
9 1 (0.40%) PowerCLI
9 1 (0.40%) vCenter Server
9 1 (0.40%) vRealize
9 1 (0.40%) WSUS
Vendors
1 134 (53.60%) ServiceNow
2 78 (31.20%) Microsoft
3 41 (16.40%) Remedy
4 15 (6.00%) BMC
4 15 (6.00%) HP
5 12 (4.80%) Ivanti
6 11 (4.40%) Splunk
7 10 (4.00%) Citrix
8 8 (3.20%) Apple
8 8 (3.20%) SAP
9 7 (2.80%) VMware
10 6 (2.40%) Oracle
10 6 (2.40%) Salesforce
11 5 (2.00%) Forcepoint
11 5 (2.00%) Fortinet
11 5 (2.00%) Workday
12 4 (1.60%) CyberArk
12 4 (1.60%) Databricks
13 3 (1.20%) Guidewire
13 3 (1.20%) Rapid7