Workshop Facilitation Contracts in London

Workshop Facilitation
England > London

The table below provides summary statistics for contract job vacancies advertised in London requiring Workshop Facilitation skills. It includes a benchmarking guide to the contractor rates offered in vacancies that cited Workshop Facilitation over the 6 months leading up to 27 July 2025, comparing them to the same period in the previous two years.

6 months to
27 Jul 2025
Same period 2024 Same period 2023
Rank 123 164 188
Rank change year-on-year +41 +24 -24
Contract jobs citing Workshop Facilitation 314 249 347
As % of all contract jobs advertised in London 2.30% 1.51% 1.42%
As % of the Processes & Methodologies category 2.49% 1.70% 1.56%
Number of daily rates quoted 209 173 241
10th Percentile £351 £400 £400
25th Percentile £425 £463 £475
Median daily rate (50th Percentile) £500 £550 £550
Median % change year-on-year -9.09% - -
75th Percentile £638 £627 £638
90th Percentile £719 £711 £725
England median daily rate £500 £550 £518
% change year-on-year -9.09% +6.09% -1.26%
Number of hourly rates quoted 1 1 6
10th Percentile - - £43.86
25th Percentile - - £46.27
Median hourly rate £70.00 £23.33 £59.50
Median % change year-on-year +200.04% -60.79% -9.62%
75th Percentile - - £66.00
90th Percentile - - £71.75
England median hourly rate £47.56 £44.02 £60.00
% change year-on-year +8.05% -26.64% +254.40%

All Process and Methodology Skills
London

Workshop Facilitation falls under the Processes and Methodologies category. For comparison with the information above, the following table provides summary statistics for all contract job vacancies requiring process or methodology skills in London.

Contract vacancies with a requirement for process or methodology skills 12,605 14,663 22,225
As % of all contract IT jobs advertised in London 92.19% 88.80% 90.69%
Number of daily rates quoted 8,439 10,404 16,155
10th Percentile £326 £350 £363
25th Percentile £425 £450 £463
Median daily rate (50th Percentile) £550 £550 £575
Median % change year-on-year - -4.35% -
75th Percentile £675 £688 £700
90th Percentile £788 £800 £800
England median daily rate £513 £525 £550
% change year-on-year -2.38% -4.55% -
Number of hourly rates quoted 238 219 239
10th Percentile £16.50 £16.19 £18.63
25th Percentile £24.66 £22.00 £24.50
Median hourly rate £29.75 £34.25 £41.50
Median % change year-on-year -13.14% -17.47% +17.73%
75th Percentile £49.75 £55.00 £65.00
90th Percentile £63.40 £71.38 £80.00
England median hourly rate £25.15 £40.33 £42.50
% change year-on-year -37.63% -5.12% +63.46%

Workshop Facilitation
Job Vacancy Trend in London

Job postings citing Workshop Facilitation as a proportion of all IT jobs advertised in London.
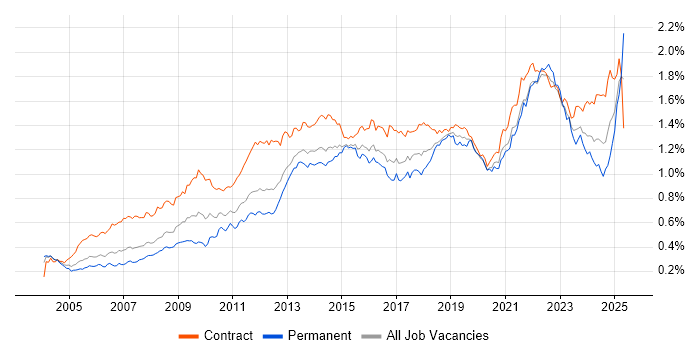
Job vacancy trend for Workshop Facilitation in London

Workshop Facilitation
Contractor Daily Rate Trend in London

3-month moving average daily rate quoted in jobs citing Workshop Facilitation in London.

Daily rate trend for Workshop Facilitation in London

Workshop Facilitation
Daily Rate Histogram in London

Daily rate distribution for jobs citing Workshop Facilitation in London over the 6 months to 27 July 2025.

Daily rate histogram for Workshop Facilitation in London

Workshop Facilitation
Contractor Hourly Rate Trend in London

3-month moving average hourly rates quoted in jobs citing Workshop Facilitation in London.

Hourly rate trend for Workshop Facilitation in London

Workshop Facilitation
Contract Job Locations in London

The table below looks at the demand and provides a guide to the median contractor rates quoted in IT jobs citing Workshop Facilitation within the London region over the 6 months to 27 July 2025. The 'Rank Change' column provides an indication of the change in demand within each location based on the same 6 month period last year.

Location Rank Change
on Same Period
Last Year
Matching
Contract
IT Job Ads
Median
Daily Rate
Past 6 Months
Median Daily Rate
% Change
on Same Period
Last Year
Live
Jobs
Central London +16 58 £575 -8.00% 13
West London -1 4 £420 -29.41% 5
East London +3 3 £495 -20.80% 3
Workshop Facilitation
England

Workshop Facilitation
Co-occurring Skills and Capabilities in London by Category

The follow tables expand on the table above by listing co-occurrences grouped by category. The same employment type, locality and period is covered with up to 20 co-occurrences shown in each of the following categories:

Application Platforms
1 27 (8.60%) Confluence
2 13 (4.14%) SharePoint
3 5 (1.59%) Microsoft Exchange
4 2 (0.64%) CMS
5 1 (0.32%) SAS
Applications
1 32 (10.19%) MS Visio
2 21 (6.69%) Microsoft Excel
3 15 (4.78%) Microsoft Office
4 11 (3.50%) Microsoft PowerPoint
5 9 (2.87%) Microsoft Project
5 9 (2.87%) Sketch
6 5 (1.59%) Adobe XD
7 1 (0.32%) Chatbot
7 1 (0.32%) Oracle Smart View
7 1 (0.32%) Spreadsheet
Business Applications
1 25 (7.96%) SAP S/4HANA
2 11 (3.50%) SAP PS
3 6 (1.91%) Dynamics CRM
3 6 (1.91%) Workday HCM
4 5 (1.59%) Salesforce CRM
4 5 (1.59%) SAP FI
5 4 (1.27%) Endur
5 4 (1.27%) SAP CO
5 4 (1.27%) SAP MDG
5 4 (1.27%) Shopify
6 3 (0.96%) SAP GTS
7 2 (0.64%) SAP CS
7 2 (0.64%) SAP FI/CO
7 2 (0.64%) SAP HCM
7 2 (0.64%) SAP PLM
7 2 (0.64%) SAP SD
7 2 (0.64%) SAP VC
7 2 (0.64%) Workfront
8 1 (0.32%) OpenText VIM for SAP
8 1 (0.32%) Sparx Enterprise Architect
Cloud Services
1 26 (8.28%) Power Platform
2 23 (7.32%) Azure
3 13 (4.14%) Figma
3 13 (4.14%) Lucidchart
4 11 (3.50%) AWS
4 11 (3.50%) GCP
5 9 (2.87%) Azure DevOps
5 9 (2.87%) Dynamics 365
6 6 (1.91%) Microsoft 365
6 6 (1.91%) Power Automate
7 5 (1.59%) PowerApps
7 5 (1.59%) SaaS
7 5 (1.59%) Snowflake
8 4 (1.27%) BigCommerce
8 4 (1.27%) Entra ID
8 4 (1.27%) IBM Blueworks
8 4 (1.27%) Miro
8 4 (1.27%) Slack
9 3 (0.96%) Google Kubernetes Engine
9 3 (0.96%) Salesforce Sales Cloud
Communications & Networking
1 3 (0.96%) VPN
2 2 (0.64%) BGP
2 2 (0.64%) BIG-IP
2 2 (0.64%) F5 BIG-IP GTM
2 2 (0.64%) F5 BIG-IP LTM
2 2 (0.64%) Firewall
2 2 (0.64%) LAN
2 2 (0.64%) Network Security
2 2 (0.64%) OSPF
2 2 (0.64%) SD-WAN
2 2 (0.64%) WAN
3 1 (0.32%) DHCP
3 1 (0.32%) DNS
3 1 (0.32%) MQTT
Database & Business Intelligence
1 24 (7.64%) Power BI
2 12 (3.82%) Tableau
3 5 (1.59%) Relational Database
4 4 (1.27%) BusinessObjects
4 4 (1.27%) Metadata
4 4 (1.27%) MS Access
5 3 (0.96%) Electronic Patient Records
5 3 (0.96%) SQL Server
6 2 (0.64%) Big Data
6 2 (0.64%) Data Warehouse
6 2 (0.64%) Tableau Desktop
6 2 (0.64%) Tableau Server
7 1 (0.32%) Azure SQL Database
7 1 (0.32%) BigQuery
7 1 (0.32%) Data Lake
7 1 (0.32%) DB2
7 1 (0.32%) Looker
7 1 (0.32%) Oracle Reports
7 1 (0.32%) Power Query
Development Applications
1 36 (11.46%) JIRA
2 9 (2.87%) Axure RP
3 5 (1.59%) GitLab
4 3 (0.96%) ERwin
4 3 (0.96%) Gradle
4 3 (0.96%) Maven
4 3 (0.96%) Selenium
4 3 (0.96%) SonarQube
5 2 (0.64%) Bitbucket
5 2 (0.64%) Git
5 2 (0.64%) Visual Studio
6 1 (0.32%) Eclipse
General
1 141 (44.90%) Social Skills
2 106 (33.76%) Finance
3 59 (18.79%) Analytical Skills
4 34 (10.83%) Banking
5 32 (10.19%) Public Sector
6 20 (6.37%) Legal
7 19 (6.05%) Retail
8 15 (4.78%) Presentation Skills
9 13 (4.14%) Marketing
10 11 (3.50%) Documentation Skills
11 9 (2.87%) Influencing Skills
12 7 (2.23%) Manufacturing
12 7 (2.23%) Organisational Skills
13 6 (1.91%) Advertising
13 6 (1.91%) Aerospace
13 6 (1.91%) Back Office
13 6 (1.91%) Front Office
14 5 (1.59%) Financial Institution
14 5 (1.59%) Investment Banking
15 4 (1.27%) Billing
Job Titles
1 149 (47.45%) Analyst
2 123 (39.17%) Business Analyst
3 43 (13.69%) Consultant
4 30 (9.55%) Senior
5 26 (8.28%) Architect
6 24 (7.64%) Designer
7 18 (5.73%) Senior Analyst
8 17 (5.41%) Senior Business Analyst
9 16 (5.10%) Lead
9 16 (5.10%) Project Manager
9 16 (5.10%) SAP Consultant
10 14 (4.46%) UX Designer
11 12 (3.82%) Technical Analyst
11 12 (3.82%) Technical Business Analyst
12 10 (3.18%) SC Cleared Business Analyst
13 9 (2.87%) Data Business Analyst
14 8 (2.55%) Process Analyst
14 8 (2.55%) Service Designer
14 8 (2.55%) Systems Analyst
15 7 (2.23%) Developer
Libraries, Frameworks & Software Standards
1 7 (2.23%) CSS
1 7 (2.23%) HTML
1 7 (2.23%) REST
2 4 (1.27%) .NET
2 4 (1.27%) DCOM
2 4 (1.27%) Kafka
2 4 (1.27%) VML
3 3 (0.96%) Lightning Web Components
3 3 (0.96%) Middleware
3 3 (0.96%) SailPoint
4 2 (0.64%) ADO
4 2 (0.64%) FHIR
4 2 (0.64%) jQuery
4 2 (0.64%) SPFx
4 2 (0.64%) Visualforce
5 1 (0.32%) ASP.NET
5 1 (0.32%) J2EE
5 1 (0.32%) SOAP
5 1 (0.32%) Web Services
5 1 (0.32%) XML
Miscellaneous
1 29 (9.24%) Product Ownership
2 14 (4.46%) Management Information System
3 10 (3.18%) Reinsurance
4 7 (2.23%) Onboarding
5 6 (1.91%) Data Centre
5 6 (1.91%) Greenfield Project
6 5 (1.59%) Cloud Native
6 5 (1.59%) Legacy Systems
7 4 (1.27%) Data Structures
7 4 (1.27%) Derivative
7 4 (1.27%) Foreign Exchange (FX)
7 4 (1.27%) NHS
7 4 (1.27%) Virtual Team
8 3 (0.96%) Data Protection Act
8 3 (0.96%) e-Learning
8 3 (0.96%) Equities
8 3 (0.96%) Marketing Technology
9 2 (0.64%) Analytical Mindset
9 2 (0.64%) Hybrid Cloud
9 2 (0.64%) Self-Motivation
Operating Systems
1 7 (2.23%) Android
1 7 (2.23%) Apple iOS
2 5 (1.59%) Windows
3 2 (0.64%) Windows 10
3 2 (0.64%) Windows Server
4 1 (0.32%) Linux
4 1 (0.32%) VMS
4 1 (0.32%) zOS
Processes & Methodologies
1 123 (39.17%) Agile
2 87 (27.71%) Stakeholder Engagement
3 79 (25.16%) Problem-Solving
4 78 (24.84%) Requirements Gathering
5 76 (24.20%) Stakeholder Management
6 52 (16.56%) Business Analysis
7 51 (16.24%) User Stories
8 46 (14.65%) Data Analysis
9 44 (14.01%) User Acceptance Testing
10 43 (13.69%) Migration
10 43 (13.69%) Project Management
11 36 (11.46%) Process Improvement
12 34 (10.83%) Decision-Making
12 34 (10.83%) Roadmaps
13 33 (10.51%) Project Delivery
14 31 (9.87%) Waterfall
15 28 (8.92%) Business Intelligence
16 27 (8.60%) Acceptance Criteria
16 27 (8.60%) Analytics
16 27 (8.60%) Continuous Improvement
Programming Languages
1 25 (7.96%) SQL
2 9 (2.87%) JavaScript
3 6 (1.91%) C#
4 5 (1.59%) Python
5 4 (1.27%) Java
6 3 (0.96%) VBA
7 2 (0.64%) ABAP
7 2 (0.64%) Apex Code
7 2 (0.64%) Korn
7 2 (0.64%) PowerShell
8 1 (0.32%) Assembly Language
8 1 (0.32%) Data Analysis Expressions
8 1 (0.32%) JCL
8 1 (0.32%) Kusto Query Language
8 1 (0.32%) REXX
8 1 (0.32%) Ruby
8 1 (0.32%) T-SQL
8 1 (0.32%) TypeScript
8 1 (0.32%) XPath
Qualifications
1 37 (11.78%) Security Cleared
2 34 (10.83%) Degree
3 31 (9.87%) SC Cleared
4 10 (3.18%) PMI Certification
5 8 (2.55%) BPSS Clearance
5 8 (2.55%) PMP
6 7 (2.23%) CBAP
7 5 (1.59%) Master's Degree
8 4 (1.27%) Microsoft Certification
9 3 (0.96%) CSPO
9 3 (0.96%) DV Cleared
9 3 (0.96%) IIBA
10 2 (0.64%) Azure Certification
10 2 (0.64%) CCA
10 2 (0.64%) CISSP
10 2 (0.64%) Computer Science Degree
10 2 (0.64%) JNCIE
10 2 (0.64%) JNCIP
10 2 (0.64%) PRINCE2 Certification
10 2 (0.64%) Six Sigma Black Belt
Quality Assurance & Compliance
1 21 (6.69%) QA
2 17 (5.41%) GDPR
3 15 (4.78%) Accessibility
4 9 (2.87%) Data Quality
5 5 (1.59%) PMO
5 5 (1.59%) Solvency II
6 4 (1.27%) Actionable Recommendations
6 4 (1.27%) MiFID
7 3 (0.96%) EMIR
7 3 (0.96%) HL7
8 2 (0.64%) California Consumer Privacy Act
8 2 (0.64%) GRC
8 2 (0.64%) HIPAA
8 2 (0.64%) ISO/IEC 27001
8 2 (0.64%) NIST
9 1 (0.32%) DICOM
9 1 (0.32%) FINRA
9 1 (0.32%) IFRS
9 1 (0.32%) IFRS 17
9 1 (0.32%) WCAG
System Software
1 12 (3.82%) Active Directory
2 3 (0.96%) Docker
3 2 (0.64%) Virtual Servers
4 1 (0.32%) Job Entry Subsystem
4 1 (0.32%) Time Sharing Option
4 1 (0.32%) Virtual Desktop
4 1 (0.32%) Virtual Machines
Systems Management
1 5 (1.59%) Terraform
2 3 (0.96%) Argo
2 3 (0.96%) Kubernetes
3 2 (0.64%) Ansible
3 2 (0.64%) Single Sign-On
4 1 (0.32%) HP Quality Center
Vendors
1 51 (16.24%) SAP
2 46 (14.65%) Microsoft
3 19 (6.05%) Salesforce
4 17 (5.41%) Oracle
5 13 (4.14%) ServiceNow
5 13 (4.14%) Workday
6 12 (3.82%) Adobe
7 10 (3.18%) Google
8 4 (1.27%) Ariba
8 4 (1.27%) Duck Creek
8 4 (1.27%) Sitecore
9 3 (0.96%) OpenLink
10 2 (0.64%) Cerner
10 2 (0.64%) CheckPoint
10 2 (0.64%) Cisco
10 2 (0.64%) Citrix
10 2 (0.64%) HubSpot
10 2 (0.64%) IBM
10 2 (0.64%) Juniper
10 2 (0.64%) Remedy