Test Engineer
UK > England
The median Test Engineer salary in England is £55,000 per year, according to job vacancies posted during the 6 months leading to 31 May 2025.
The table below provides salary benchmarking and summary statistics, comparing them to the same period in the previous two years.
| 6 months to 31 May 2025 |
Same period 2024 | Same period 2023 | |
|---|---|---|---|
| Rank | 141 | 519 | 492 |
| Rank change year-on-year | +378 | -27 | +22 |
| Permanent jobs requiring a Test Engineer | 1,127 | 351 | 483 |
| As % of all permanent jobs advertised in England | 2.29% | 0.39% | 0.57% |
| As % of the Job Titles category | 2.52% | 0.41% | 0.62% |
| Number of salaries quoted | 147 | 188 | 342 |
| 10th Percentile | £38,825 | £32,675 | £33,750 |
| 25th Percentile | £40,000 | £38,563 | £41,250 |
| Median annual salary (50th Percentile) | £55,000 | £45,000 | £54,082 |
| Median % change year-on-year | +22.22% | -16.79% | +4.00% |
| 75th Percentile | £60,000 | £55,000 | £65,000 |
| 90th Percentile | £62,800 | £65,000 | £75,000 |
| UK median annual salary | £55,000 | £45,000 | £54,000 |
| % change year-on-year | +22.22% | -16.67% | +8.00% |
All Permanent IT Job Vacancies
England
For comparison with the information above, the following table provides summary statistics for all permanent IT job vacancies in England. Most job vacancies include a discernible job title that can be normalized. As such, the figures in the second row provide an indication of the number of permanent jobs in our overall sample.
| Permanent vacancies in England with a recognized job title | 44,774 | 85,031 | 77,815 |
| % of permanent jobs with a recognized job title | 90.79% | 94.67% | 91.36% |
| Number of salaries quoted | 23,692 | 62,917 | 50,230 |
| 10th Percentile | £29,000 | £28,500 | £32,750 |
| 25th Percentile | £41,000 | £38,066 | £45,000 |
| Median annual salary (50th Percentile) | £56,000 | £52,500 | £60,567 |
| Median % change year-on-year | +6.67% | -13.32% | +0.95% |
| 75th Percentile | £75,000 | £71,250 | £81,250 |
| 90th Percentile | £96,250 | £90,000 | £100,000 |
| UK median annual salary | £55,000 | £52,500 | £60,000 |
| % change year-on-year | +4.76% | -12.50% | - |
Test Engineer
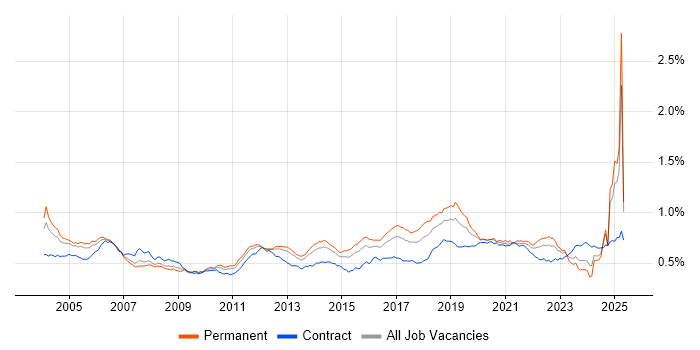
Job Vacancy Trend in England
Job postings that featured Test Engineer in the job title as a proportion of all IT jobs advertised in England.

Test Engineer
Salary Trend in England
3-month moving average salary quoted in jobs citing Test Engineer in England.
Test Engineer
Salary Histogram in England
Salary distribution for jobs citing Test Engineer in England over the 6 months to 31 May 2025.
Test Engineer
Job Locations in England
The table below looks at the demand and provides a guide to the median salaries quoted in IT jobs citing Test Engineer within the England region over the 6 months to 31 May 2025. The 'Rank Change' column provides an indication of the change in demand within each location based on the same 6 month period last year.
| Location | Rank Change on Same Period Last Year |
Matching Permanent IT Job Ads |
Median Salary Past 6 Months |
Median Salary % Change on Same Period Last Year |
Live Jobs |
|---|---|---|---|---|---|
| South East | +217 | 404 | £60,000 | +33.33% | 85 |
| East of England | +155 | 378 | £42,000 | -6.67% | 52 |
| Midlands | +183 | 232 | £34,000 | -20.00% | 75 |
| East Midlands | +164 | 221 | £33,000 | -17.50% | 25 |
| South West | +89 | 39 | £52,500 | +5.26% | 75 |
| London | +111 | 31 | £46,500 | -25.60% | 39 |
| North of England | +34 | 30 | £46,250 | +5.71% | 69 |
| North West | +11 | 22 | £45,000 | -5.26% | 38 |
| West Midlands | +19 | 11 | £60,000 | +41.18% | 50 |
| Yorkshire | +45 | 8 | £59,800 | +54.32% | 18 |
| Test Engineer UK |
|||||
Test Engineer Skill Set
Top 30 Co-occurring Skills and Capabilities in England
For the 6 months to 31 May 2025, Test Engineer job roles required the following skills and capabilities in order of popularity. The figures indicate the absolute number co-occurrences and as a proportion of all permanent job ads across the England region featuring Test Engineer in the job title.
|
|
Test Engineer Skill Set
Co-occurring Skills and Capabilities in England by Category
The follow tables expand on the table above by listing co-occurrences grouped by category. The same employment type, locality and period is covered with up to 20 co-occurrences shown in each of the following categories:
|
|
||||||||||||||||||||||||||||||||||||||||||||||||||||||||||||||||||||||||||||||||||||||||||||||||||||||||||||||||||||||||||||||
|
|
||||||||||||||||||||||||||||||||||||||||||||||||||||||||||||||||||||||||||||||||||||||||||||||||||||||||||||||||||||||||||||||
|
|
||||||||||||||||||||||||||||||||||||||||||||||||||||||||||||||||||||||||||||||||||||||||||||||||||||||||||||||||||||||||||||||
|
|
||||||||||||||||||||||||||||||||||||||||||||||||||||||||||||||||||||||||||||||||||||||||||||||||||||||||||||||||||||||||||||||
|
|
||||||||||||||||||||||||||||||||||||||||||||||||||||||||||||||||||||||||||||||||||||||||||||||||||||||||||||||||||||||||||||||
|
|
||||||||||||||||||||||||||||||||||||||||||||||||||||||||||||||||||||||||||||||||||||||||||||||||||||||||||||||||||||||||||||||
|
|
||||||||||||||||||||||||||||||||||||||||||||||||||||||||||||||||||||||||||||||||||||||||||||||||||||||||||||||||||||||||||||||
|
|
||||||||||||||||||||||||||||||||||||||||||||||||||||||||||||||||||||||||||||||||||||||||||||||||||||||||||||||||||||||||||||||
|
|
||||||||||||||||||||||||||||||||||||||||||||||||||||||||||||||||||||||||||||||||||||||||||||||||||||||||||||||||||||||||||||||
