API Integration Jobs in London

API Integration
England > London

The table below provides summary statistics for permanent job vacancies advertised in London requiring API Integration skills. It includes a benchmarking guide to the annual salaries offered in vacancies that cited API Integration over the 6 months leading up to 3 May 2025, comparing them to the same period in the previous two years.

6 months to
3 May 2025
Same period 2024 Same period 2023
Rank 278 381 480
Rank change year-on-year +103 +99 -48
Permanent jobs citing API Integration 123 126 151
As % of all permanent jobs advertised in London 0.97% 0.53% 0.43%
As % of the Processes & Methodologies category 1.01% 0.58% 0.45%
Number of salaries quoted 100 109 110
10th Percentile £46,875 £49,250 £52,500
25th Percentile £50,000 £57,750 £60,563
Median annual salary (50th Percentile) £69,750 £72,500 £75,000
Median % change year-on-year -3.79% -3.33% +7.14%
75th Percentile £100,000 £85,000 £85,938
90th Percentile £119,225 £96,250 £95,750
England median annual salary £75,000 £55,000 £66,000
% change year-on-year +36.36% -16.67% -14.84%

All Process and Methodology Skills
London

API Integration falls under the Processes and Methodologies category. For comparison with the information above, the following table provides summary statistics for all permanent job vacancies requiring process or methodology skills in London.

Permanent vacancies with a requirement for process or methodology skills 12,213 21,556 33,737
As % of all permanent jobs advertised in London 96.04% 91.32% 95.36%
Number of salaries quoted 7,469 16,061 24,162
10th Percentile £42,500 £38,000 £43,750
25th Percentile £56,250 £52,000 £55,000
Median annual salary (50th Percentile) £75,000 £70,000 £75,000
Median % change year-on-year +7.14% -6.67% +7.14%
75th Percentile £100,000 £95,000 £95,000
90th Percentile £123,750 £115,000 £115,000
England median annual salary £57,500 £55,000 £62,500
% change year-on-year +4.55% -12.00% +4.17%

API Integration
Job Vacancy Trend in London

Job postings citing API Integration as a proportion of all IT jobs advertised in London.
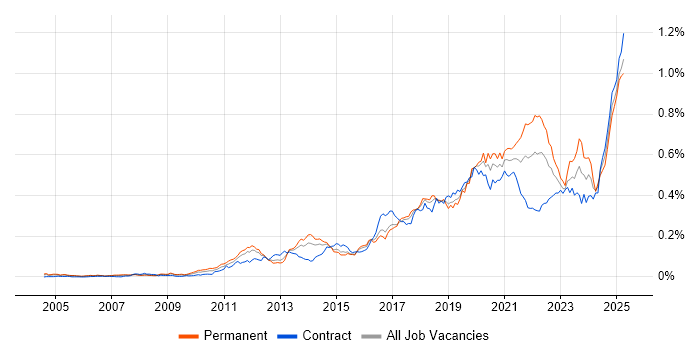
Job vacancy trend for API Integration in London

API Integration
Salary Trend in London

3-month moving average salary quoted in jobs citing API Integration in London.

Salary trend for API Integration in London

API Integration
Salary Histogram in London

Salary distribution for jobs citing API Integration in London over the 6 months to 3 May 2025.

Salary histogram for API Integration in London

API Integration
Job Locations in London

The table below looks at the demand and provides a guide to the median salaries quoted in IT jobs citing API Integration within the London region over the 6 months to 3 May 2025. The 'Rank Change' column provides an indication of the change in demand within each location based on the same 6 month period last year.

Location Rank Change
on Same Period
Last Year
Matching
Permanent
IT Job Ads
Median Salary
Past 6 Months
Median Salary
% Change
on Same Period
Last Year
Live
Jobs
Central London +13 26 £71,250 - 3
West London +63 16 £50,000 -27.27%
East London - 2 £100,000 -
API Integration
England

API Integration
Co-occurring Skills and Capabilities in London by Category

The follow tables expand on the table above by listing co-occurrences grouped by category. The same employment type, locality and period is covered with up to 20 co-occurrences shown in each of the following categories:

Application Platforms
1 3 (2.44%) CMS
1 3 (2.44%) Confluence
1 3 (2.44%) OpenEdge
2 1 (0.81%) Apache
2 1 (0.81%) Apache Airflow
2 1 (0.81%) Headless CMS
2 1 (0.81%) SharePoint
Applications
1 4 (3.25%) MS Visio
2 2 (1.63%) Adobe XD
3 1 (0.81%) Microsoft Excel
3 1 (0.81%) Microsoft Office
3 1 (0.81%) Microsoft PowerPoint
3 1 (0.81%) Microsoft Project
Business Applications
1 12 (9.76%) Postilion
2 7 (5.69%) NetSuite
3 6 (4.88%) Oracle EBS
4 3 (2.44%) Shopify
5 2 (1.63%) Dynamics CRM
6 1 (0.81%) Elite 3E
6 1 (0.81%) Endur
6 1 (0.81%) Payment Gateway
6 1 (0.81%) SAP Hybris
Cloud Services
1 32 (26.02%) AWS
2 24 (19.51%) Azure
3 20 (16.26%) Serverless
4 11 (8.94%) Cloud Computing
5 9 (7.32%) GitHub
5 9 (7.32%) SaaS
6 8 (6.50%) Power Platform
7 6 (4.88%) Azure DevOps
7 6 (4.88%) Azure Logic Apps
8 4 (3.25%) Apigee
8 4 (3.25%) GCP
8 4 (3.25%) Power Automate
8 4 (3.25%) PowerApps
8 4 (3.25%) Salesforce Service Cloud
9 3 (2.44%) Snowflake
10 2 (1.63%) Azure Functions
10 2 (1.63%) Azure Sentinel
10 2 (1.63%) Azure Service Bus
10 2 (1.63%) Dynamics 365
10 2 (1.63%) Figma
Communications & Networking
1 22 (17.89%) HTTP
2 12 (9.76%) ATM
3 1 (0.81%) BGP
3 1 (0.81%) Ethernet
3 1 (0.81%) Firewall
3 1 (0.81%) Internet
3 1 (0.81%) Network Security
3 1 (0.81%) SWIFTNet
3 1 (0.81%) TCP/IP
Database & Business Intelligence
1 14 (11.38%) SQL Server
2 8 (6.50%) Amazon QuickSight
3 7 (5.69%) Power BI
4 6 (4.88%) Tableau
5 4 (3.25%) GIS
6 3 (2.44%) Data Lake
6 3 (2.44%) Data Warehouse
6 3 (2.44%) MongoDB
6 3 (2.44%) NoSQL
7 2 (1.63%) PostgreSQL
8 1 (0.81%) Amazon Aurora
8 1 (0.81%) Amazon RDS
8 1 (0.81%) Azure SQL Database
8 1 (0.81%) Big Data
8 1 (0.81%) DynamoDB
8 1 (0.81%) FileMaker
8 1 (0.81%) MySQL
8 1 (0.81%) Neo4j
8 1 (0.81%) Power Query
8 1 (0.81%) SQL Server Reporting Services
Development Applications
1 29 (23.58%) Git
2 16 (13.01%) JIRA
3 10 (8.13%) PowerBuilder
4 4 (3.25%) JUnit
4 4 (3.25%) NUnit
5 3 (2.44%) Atlassian Bamboo
5 3 (2.44%) Bitbucket
5 3 (2.44%) Cypress.io
5 3 (2.44%) Postman
5 3 (2.44%) Selenium
6 2 (1.63%) Mocha
6 2 (1.63%) Xcode
7 1 (0.81%) Android Studio
7 1 (0.81%) CircleCI
7 1 (0.81%) Crashlytics
7 1 (0.81%) Crucible
7 1 (0.81%) Jenkins
General
1 41 (33.33%) Finance
2 35 (28.46%) Social Skills
3 22 (17.89%) Banking
4 21 (17.07%) Analytical Skills
5 9 (7.32%) Front Office
6 8 (6.50%) Electronics
6 8 (6.50%) Inclusion and Diversity
6 8 (6.50%) Manufacturing
6 8 (6.50%) Public Sector
7 7 (5.69%) Agriculture
7 7 (5.69%) Retail
8 5 (4.07%) Advertising
8 5 (4.07%) Investment Banking
9 3 (2.44%) Documentation Skills
9 3 (2.44%) Presentation Skills
10 2 (1.63%) Financial Institution
10 2 (1.63%) Law
10 2 (1.63%) Marketing
10 2 (1.63%) Retail Banking
11 1 (0.81%) Legal
Job Titles
1 39 (31.71%) Developer
2 22 (17.89%) Lead
3 19 (15.45%) Senior
4 16 (13.01%) Architect
4 16 (13.01%) Solutions Architect
5 13 (10.57%) Payments Architect
5 13 (10.57%) Payments Solutions Architect
6 12 (9.76%) Mainframe Architect
7 11 (8.94%) Technical Leader
8 9 (7.32%) Consultant
8 9 (7.32%) Reliability Engineer
8 9 (7.32%) Systems Engineer
9 8 (6.50%) Automation Engineer
9 8 (6.50%) Robotics Engineer
9 8 (6.50%) Senior Developer
10 7 (5.69%) JavaScript Developer
10 7 (5.69%) NetSuite Consultant
10 7 (5.69%) React Developer
10 7 (5.69%) Technical Consultant
10 7 (5.69%) UI Developer
Libraries, Frameworks & Software Standards
1 34 (27.64%) React
2 28 (22.76%) SOAP
3 27 (21.95%) .NET
3 27 (21.95%) REST
4 21 (17.07%) HTML
4 21 (17.07%) RESTful
5 19 (15.45%) GraphQL
6 16 (13.01%) JSON
7 13 (10.57%) CSS
7 13 (10.57%) XML
8 10 (8.13%) JWT
8 10 (8.13%) Node.js
9 7 (5.69%) Restlet
10 6 (4.88%) .NET Core
10 6 (4.88%) Jest
10 6 (4.88%) Middleware
10 6 (4.88%) OAuth
10 6 (4.88%) Svelte
11 5 (4.07%) OAuth2
11 5 (4.07%) Redux
Miscellaneous
1 17 (13.82%) Product Ownership
2 12 (9.76%) IBM Mainframe
2 12 (9.76%) Mainframe
3 10 (8.13%) Reinsurance
4 8 (6.50%) Robotics
4 8 (6.50%) SCADA
5 7 (5.69%) Data Structures
5 7 (5.69%) Legacy Systems
6 6 (4.88%) Cloud Native
6 6 (4.88%) Greenfield Project
7 3 (2.44%) Clustering
7 3 (2.44%) Onboarding
8 2 (1.63%) Management Information System
8 2 (1.63%) Mobile App
8 2 (1.63%) Security Operations Centre
8 2 (1.63%) Security Posture
9 1 (0.81%) Algorithms
9 1 (0.81%) Data Centre
9 1 (0.81%) Digital Media
9 1 (0.81%) Linked Data
Operating Systems
1 12 (9.76%) zOS
2 4 (3.25%) Linux
3 3 (2.44%) Solaris
4 2 (1.63%) Android
4 2 (1.63%) Apple iOS
4 2 (1.63%) Unix
5 1 (0.81%) Windows
5 1 (0.81%) Windows Server
5 1 (0.81%) Windows Server 2008
5 1 (0.81%) Windows Server 2019
Processes & Methodologies
1 45 (36.59%) Problem-Solving
2 41 (33.33%) CI/CD
3 34 (27.64%) Agile
3 34 (27.64%) Microservices
4 33 (26.83%) API Development
4 33 (26.83%) DevOps
5 22 (17.89%) Computer Science
6 20 (16.26%) Analytics
7 16 (13.01%) Requirements Gathering
8 15 (12.20%) Data Extraction
8 15 (12.20%) Data Pipeline
8 15 (12.20%) Roadmaps
8 15 (12.20%) Visualisation
9 14 (11.38%) Data Modelling
10 13 (10.57%) Continuous Integration
11 12 (9.76%) Containerisation
11 12 (9.76%) Continuous Improvement
11 12 (9.76%) Software Engineering
12 11 (8.94%) Data Governance
12 11 (8.94%) Full-Stack Development
Programming Languages
1 41 (33.33%) JavaScript
1 41 (33.33%) Python
2 38 (30.89%) SQL
3 24 (19.51%) C#
4 12 (9.76%) Java
5 8 (6.50%) C
5 8 (6.50%) R
6 7 (5.69%) PowerShell
6 7 (5.69%) TypeScript
7 4 (3.25%) Apex Code
7 4 (3.25%) Bash
8 3 (2.44%) OpenEdge ABL
8 3 (2.44%) Perl
8 3 (2.44%) Progress 4GL
8 3 (2.44%) Ruby
9 2 (1.63%) Kotlin
9 2 (1.63%) Kusto Query Language
10 1 (0.81%) Go
10 1 (0.81%) PHP
10 1 (0.81%) Swift
Qualifications
1 28 (22.76%) Degree
2 22 (17.89%) Computer Science Degree
3 8 (6.50%) Numerate Degree
4 5 (4.07%) SC Cleared
4 5 (4.07%) Security Cleared
5 4 (3.25%) Azure Certification
5 4 (3.25%) Master's Degree
6 2 (1.63%) Microsoft Certification
7 1 (0.81%) CCNP
7 1 (0.81%) Cisco Certification
7 1 (0.81%) PMI Certification
7 1 (0.81%) PMP
7 1 (0.81%) TOGAF Certification
Quality Assurance & Compliance
1 8 (6.50%) SLA
2 5 (4.07%) Accessibility
3 3 (2.44%) GDPR
3 3 (2.44%) QA
3 3 (2.44%) Sarbanes-Oxley
3 3 (2.44%) WCAG
4 1 (0.81%) Data Quality
4 1 (0.81%) ISO 20022
4 1 (0.81%) ISO/IEC 27001
System Software
1 16 (13.01%) Docker
2 2 (1.63%) Active Directory
Systems Management
1 21 (17.07%) Kubernetes
2 7 (5.69%) Ansible
3 4 (3.25%) Grafana
3 4 (3.25%) Terraform
4 2 (1.63%) Progress Chef
4 2 (1.63%) Prometheus
5 1 (0.81%) Red Hat Satellite
Vendors
1 25 (20.33%) Microsoft
2 12 (9.76%) IBM
3 7 (5.69%) Oracle
4 6 (4.88%) Salesforce
5 4 (3.25%) Databricks
5 4 (3.25%) Google
5 4 (3.25%) MuleSoft
5 4 (3.25%) Okta
6 3 (2.44%) Progress
6 3 (2.44%) Red Hat
7 2 (1.63%) Adobe
7 2 (1.63%) SAP
7 2 (1.63%) ServiceNow
7 2 (1.63%) Snow
7 2 (1.63%) Splunk
8 1 (0.81%) Cisco
8 1 (0.81%) Intapp
8 1 (0.81%) Palo Alto
8 1 (0.81%) Ping Identity
8 1 (0.81%) Sybase