Apple iOS Jobs in London

Apple iOS
England > London

The table below provides summary statistics for permanent job vacancies advertised in London requiring Apple iOS skills. It includes a benchmarking guide to the annual salaries offered in vacancies that cited Apple iOS over the 6 months leading up to 28 May 2025, comparing them to the same period in the previous two years.

6 months to
28 May 2025
Same period 2024 Same period 2023
Rank 262 302 233
Rank change year-on-year +40 -69 -100
Permanent jobs citing Apple iOS 131 231 512
As % of all permanent jobs advertised in London 1.05% 0.97% 1.55%
As % of the Operating Systems category 7.73% 7.73% 9.74%
Number of salaries quoted 77 181 354
10th Percentile £25,000 £30,000 £30,000
25th Percentile £40,000 £39,000 £38,375
Median annual salary (50th Percentile) £63,500 £65,000 £62,500
Median % change year-on-year -2.31% +4.00% -9.52%
75th Percentile £83,750 £90,000 £89,577
90th Percentile £91,500 £96,250 £111,750
England median annual salary £52,500 £45,000 £55,000
% change year-on-year +16.67% -18.18% -8.33%

All Operating Systems
London

Apple iOS falls under the Operating Systems category. For comparison with the information above, the following table provides summary statistics for all permanent job vacancies requiring operating system skills in London.

Permanent vacancies with a requirement for operating system skills 1,695 2,987 5,255
As % of all permanent jobs advertised in London 13.55% 12.56% 15.86%
Number of salaries quoted 1,121 2,262 4,018
10th Percentile £32,500 £31,250 £32,500
25th Percentile £42,500 £41,250 £44,310
Median annual salary (50th Percentile) £65,000 £62,500 £65,000
Median % change year-on-year +4.00% -3.85% -
75th Percentile £85,000 £83,750 £90,000
90th Percentile £110,000 £102,500 £110,000
England median annual salary £45,000 £45,000 £52,500
% change year-on-year - -14.29% -

Apple iOS
Job Vacancy Trend in London

Job postings citing Apple iOS as a proportion of all IT jobs advertised in London.
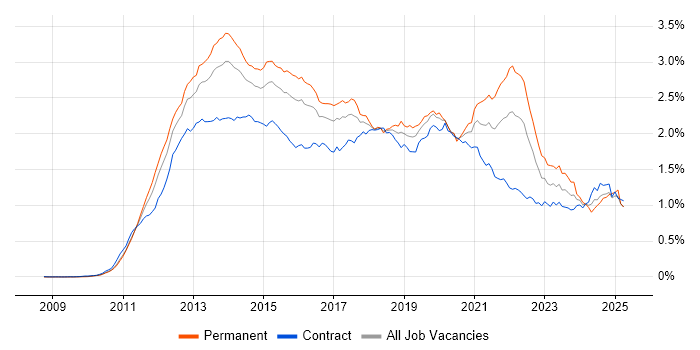
Job vacancy trend for Apple iOS in London

Apple iOS
Salary Trend in London

3-month moving average salary quoted in jobs citing Apple iOS in London.

Salary trend for Apple iOS in London

Apple iOS
Salary Histogram in London

Salary distribution for jobs citing Apple iOS in London over the 6 months to 28 May 2025.

Salary histogram for Apple iOS in London

Apple iOS
Job Locations in London

The table below looks at the demand and provides a guide to the median salaries quoted in IT jobs citing Apple iOS within the London region over the 6 months to 28 May 2025. The 'Rank Change' column provides an indication of the change in demand within each location based on the same 6 month period last year.

Location Rank Change
on Same Period
Last Year
Matching
Permanent
IT Job Ads
Median Salary
Past 6 Months
Median Salary
% Change
on Same Period
Last Year
Live
Jobs
Central London +29 24 £55,000 - 17
West London +30 10 £30,000 -29.41% 6
East London - 5 £52,500 - 5
South London -7 1 - -
Apple iOS
England

Apple iOS
Co-occurring Skills and Capabilities in London by Category

The follow tables expand on the table above by listing co-occurrences grouped by category. The same employment type, locality and period is covered with up to 20 co-occurrences shown in each of the following categories:

Application Platforms
1 14 (10.69%) SharePoint
2 8 (6.11%) Microsoft Exchange
3 1 (0.76%) CMS
3 1 (0.76%) Confluence
3 1 (0.76%) Drupal
3 1 (0.76%) WordPress
Applications
1 13 (9.92%) Microsoft Office
2 8 (6.11%) Microsoft Excel
3 7 (5.34%) Microsoft PowerPoint
4 3 (2.29%) UserZoom
5 2 (1.53%) Acrobat
6 1 (0.76%) Adobe XD
6 1 (0.76%) Sketch
Cloud Services
1 30 (22.90%) Azure
2 29 (22.14%) Microsoft 365
3 20 (15.27%) GitHub
4 16 (12.21%) Entra ID
5 11 (8.40%) OneDrive
6 9 (6.87%) Figma
7 7 (5.34%) AWS
7 7 (5.34%) GitHub Actions
8 4 (3.05%) Cloud Computing
8 4 (3.05%) Nutanix
9 3 (2.29%) Mimecast
10 2 (1.53%) Bitrise
10 2 (1.53%) Firebase
10 2 (1.53%) GCP
11 1 (0.76%) AWS Lambda
11 1 (0.76%) BrowserStack
11 1 (0.76%) Google Play
11 1 (0.76%) Power Platform
11 1 (0.76%) Serverless
11 1 (0.76%) ShareGate
Communications & Networking
1 13 (9.92%) Firewall
2 8 (6.11%) DHCP
2 8 (6.11%) DNS
2 8 (6.11%) LAN
3 6 (4.58%) WAN
4 4 (3.05%) Network Security
4 4 (3.05%) TCP/IP
4 4 (3.05%) VLAN
4 4 (3.05%) VPN
4 4 (3.05%) WebEx
4 4 (3.05%) Wi-Fi
5 3 (2.29%) HTTP
6 2 (1.53%) Ethernet
6 2 (1.53%) Softphone
6 2 (1.53%) VoIP
6 2 (1.53%) Wireless
7 1 (0.76%) ADSL
7 1 (0.76%) DKIM
7 1 (0.76%) DMARC
7 1 (0.76%) WLAN
Database & Business Intelligence
1 12 (9.16%) DB2
1 12 (9.16%) MongoDB
1 12 (9.16%) PostgreSQL
2 11 (8.40%) NoSQL
3 6 (4.58%) GIS
4 5 (3.82%) SQL Server
5 2 (1.53%) Relational Database
6 1 (0.76%) BigQuery
6 1 (0.76%) DynamoDB
Development Applications
1 13 (9.92%) Git
2 12 (9.16%) Jenkins
3 7 (5.34%) Appium
3 7 (5.34%) Gradle
3 7 (5.34%) SonarQube
3 7 (5.34%) Xcode
4 6 (4.58%) Android Studio
5 5 (3.82%) XCUITest
6 2 (1.53%) Crashlytics
6 2 (1.53%) GitLab
7 1 (0.76%) Charles Proxy
7 1 (0.76%) CircleCI
7 1 (0.76%) fastlane
7 1 (0.76%) git-flow
7 1 (0.76%) JIRA
7 1 (0.76%) JUnit
7 1 (0.76%) Travis CI
7 1 (0.76%) UI Automator
7 1 (0.76%) Visual Studio Code
General
1 50 (38.17%) Social Skills
2 24 (18.32%) Finance
3 22 (16.79%) Games
3 22 (16.79%) Inclusion and Diversity
4 15 (11.45%) Public Sector
5 9 (6.87%) Law
6 6 (4.58%) Analytical Skills
6 6 (4.58%) Influencing Skills
6 6 (4.58%) Marketing
7 4 (3.05%) Documentation Skills
7 4 (3.05%) Organisational Skills
8 3 (2.29%) Telecoms
9 2 (1.53%) Banking
9 2 (1.53%) Legal
9 2 (1.53%) Presentation Skills
9 2 (1.53%) Private Banking
9 2 (1.53%) Publishing
10 1 (0.76%) Billing
10 1 (0.76%) Retail
Job Titles
1 34 (25.95%) Developer
2 33 (25.19%) Senior
3 20 (15.27%) Lead
4 18 (13.74%) Analyst
4 18 (13.74%) Android Developer
5 15 (11.45%) Azure Engineer
6 13 (9.92%) iOS Developer
7 12 (9.16%) Support Analyst
8 11 (8.40%) Full-Stack Engineer
9 9 (6.87%) Lead Developer
9 9 (6.87%) Senior Developer
10 8 (6.11%) IT Support
11 7 (5.34%) iOS Android Developer
11 7 (5.34%) Lead Android Developer
11 7 (5.34%) Lead iOS Developer
11 7 (5.34%) Technical Support
12 6 (4.58%) Technical Leader
13 5 (3.82%) Designer
13 5 (3.82%) Desktop Support
13 5 (3.82%) Tester
Libraries, Frameworks & Software Standards
1 25 (19.08%) React
2 19 (14.50%) React Native
3 12 (9.16%) AngularJS
3 12 (9.16%) Backbone.js
3 12 (9.16%) Bootstrap
3 12 (9.16%) Ember.js
3 12 (9.16%) jQuery
4 11 (8.40%) REST
4 11 (8.40%) RESTful
5 9 (6.87%) SwiftUI
6 7 (5.34%) CSS
6 7 (5.34%) HTML
6 7 (5.34%) Unity (Game Engine)
6 7 (5.34%) Web Services
7 4 (3.05%) ARM Templates
7 4 (3.05%) Redux
7 4 (3.05%) UIKit
8 3 (2.29%) Android Jetpack
8 3 (2.29%) Flutter
8 3 (2.29%) Jetpack Compose
Miscellaneous
1 51 (38.93%) Mobile App
2 17 (12.98%) Mobile Games
3 13 (9.92%) Algorithms
3 13 (9.92%) Data Structures
4 12 (9.16%) Hybrid Cloud
5 11 (8.40%) Educational Technology
5 11 (8.40%) e-Learning
6 8 (6.11%) Video Conferencing
7 7 (5.34%) Legacy Systems
8 6 (4.58%) Product Ownership
9 5 (3.82%) Onboarding
10 4 (3.05%) Cloud Native
10 4 (3.05%) Clustering
10 4 (3.05%) Hedge funds
11 3 (2.29%) Hackathon
11 3 (2.29%) Management Information System
11 3 (2.29%) Online Games
11 3 (2.29%) Self-Motivation
12 2 (1.53%) Handset
13 1 (0.76%) PKI
Operating Systems
1 96 (73.28%) Android
2 45 (34.35%) Windows
3 23 (17.56%) Linux
4 17 (12.98%) Windows 10
5 13 (9.92%) Windows Server
6 9 (6.87%) Mac OS
7 4 (3.05%) Windows Server 2012
Processes & Methodologies
1 52 (39.69%) Agile
1 52 (39.69%) User Experience
2 33 (25.19%) iOS Development
3 31 (23.66%) Problem-Solving
4 29 (22.14%) Android Development
5 27 (20.61%) Mentoring
6 26 (19.85%) Coaching
7 24 (18.32%) DevOps
8 22 (16.79%) Mobile Development
9 20 (15.27%) CI/CD
9 20 (15.27%) Migration
10 17 (12.98%) Design Patterns
11 16 (12.21%) Artificial Intelligence
11 16 (12.21%) Design Thinking
12 15 (11.45%) Code Quality
12 15 (11.45%) Mobile Application Development
12 15 (11.45%) Software Engineering
12 15 (11.45%) SOLID
13 13 (9.92%) Customer Experience
13 13 (9.92%) Prototyping
Programming Languages
1 40 (30.53%) Swift
2 21 (16.03%) Java
2 21 (16.03%) Kotlin
2 21 (16.03%) Objective-C
3 15 (11.45%) JavaScript
4 14 (10.69%) SQL
4 14 (10.69%) TypeScript
5 5 (3.82%) PowerShell
6 4 (3.05%) C#
7 3 (2.29%) Python
8 2 (1.53%) Go
8 2 (1.53%) PHP
9 1 (0.76%) C
9 1 (0.76%) C++
9 1 (0.76%) Dart
9 1 (0.76%) Rust
Qualifications
1 13 (9.92%) Degree
2 8 (6.11%) Computer Science Degree
3 3 (2.29%) BPSS Clearance
3 3 (2.29%) SC Cleared
3 3 (2.29%) Security Cleared
4 2 (1.53%) DBS Check
4 2 (1.53%) ITIL Foundation Certificate
Quality Assurance & Compliance
1 25 (19.08%) QA
2 17 (12.98%) Accessibility
3 9 (6.87%) WCAG
4 5 (3.82%) SLA
5 1 (0.76%) Cyber Essentials
5 1 (0.76%) Cyber Essentials PLUS
System Software
1 21 (16.03%) Active Directory
2 4 (3.05%) Hyper-V
2 4 (3.05%) VMware Infrastructure
Systems Management
1 18 (13.74%) Microsoft Intune
2 8 (6.11%) SCCM
3 4 (3.05%) Failover Clustering
3 4 (3.05%) Kubernetes
3 4 (3.05%) Terraform
4 2 (1.53%) AirWatch
Vendors
1 31 (23.66%) Microsoft
2 13 (9.92%) Apple
3 12 (9.16%) IBM
3 12 (9.16%) Red Hat
4 10 (7.63%) VMware
5 7 (5.34%) New Relic
5 7 (5.34%) Sophos
6 5 (3.82%) Citrix
6 5 (3.82%) ServiceNow
7 4 (3.05%) N-able
7 4 (3.05%) Palo Alto
8 3 (2.29%) Adobe
8 3 (2.29%) Meraki
9 2 (1.53%) Google
9 2 (1.53%) HP
9 2 (1.53%) Qualys
9 2 (1.53%) Samsung
10 1 (0.76%) Logitech
10 1 (0.76%) OpenAI
10 1 (0.76%) SkyKick