C
England > London
The table below provides summary statistics for permanent job vacancies advertised in London requiring C skills. It includes a benchmarking guide to the annual salaries offered in vacancies that cited C over the 6 months leading up to 31 May 2025, comparing them to the same period in the previous two years.
| 6 months to 31 May 2025 |
Same period 2024 | Same period 2023 | |
|---|---|---|---|
| Rank | 267 | 284 | 327 |
| Rank change year-on-year | +17 | +43 | +20 |
| Permanent jobs citing C | 131 | 241 | 326 |
| As % of all permanent jobs advertised in London | 1.03% | 1.00% | 1.01% |
| As % of the Programming Languages category | 2.50% | 2.50% | 2.07% |
| Number of salaries quoted | 59 | 194 | 191 |
| 10th Percentile | £57,250 | £45,600 | £41,000 |
| 25th Percentile | £81,875 | £61,250 | £58,750 |
| Median annual salary (50th Percentile) | £90,000 | £82,500 | £69,447 |
| Median % change year-on-year | +9.09% | +18.80% | -9.81% |
| 75th Percentile | £115,000 | £113,125 | £83,750 |
| 90th Percentile | - | £125,000 | £110,000 |
| England median annual salary | £57,836 | £57,500 | £62,500 |
| % change year-on-year | +0.58% | -8.00% | +8.70% |
All Programming Languages
London
C falls under the Programming Languages category. For comparison with the information above, the following table provides summary statistics for all permanent job vacancies requiring coding skills in London.
| Permanent vacancies with a requirement for coding skills | 5,233 | 9,628 | 15,729 |
| As % of all permanent jobs advertised in London | 40.95% | 40.07% | 48.87% |
| Number of salaries quoted | 3,554 | 7,577 | 11,995 |
| 10th Percentile | £50,000 | £47,500 | £48,750 |
| 25th Percentile | £61,250 | £60,000 | £60,000 |
| Median annual salary (50th Percentile) | £82,500 | £80,000 | £80,000 |
| Median % change year-on-year | +3.13% | - | +6.67% |
| 75th Percentile | £110,000 | £102,500 | £100,000 |
| 90th Percentile | £132,500 | £130,000 | £122,500 |
| England median annual salary | £60,000 | £60,000 | £65,000 |
| % change year-on-year | - | -7.69% | +4.00% |
C
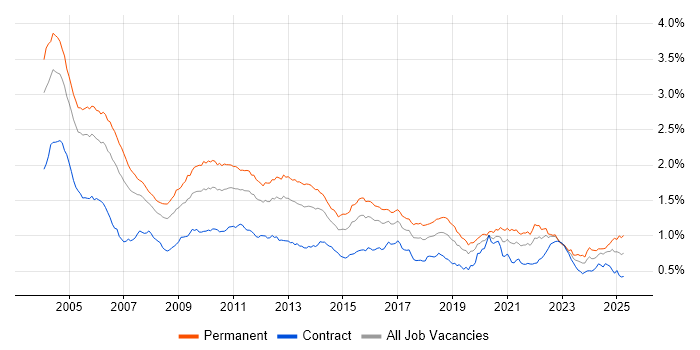
Job Vacancy Trend in London
Job postings citing C as a proportion of all IT jobs advertised in London.

C
Salary Trend in London
3-month moving average salary quoted in jobs citing C in London.
C
Salary Histogram in London
Salary distribution for jobs citing C in London over the 6 months to 31 May 2025.
C
Job Locations in London
The table below looks at the demand and provides a guide to the median salaries quoted in IT jobs citing C within the London region over the 6 months to 31 May 2025. The 'Rank Change' column provides an indication of the change in demand within each location based on the same 6 month period last year.
| Location | Rank Change on Same Period Last Year |
Matching Permanent IT Job Ads |
Median Salary Past 6 Months |
Median Salary % Change on Same Period Last Year |
Live Jobs |
|---|---|---|---|---|---|
| Central London | +11 | 4 | £57,500 | -36.11% | 9 |
| East London | -18 | 3 | - | - | 1 |
| South London | 0 | 2 | £65,000 | +18.18% | |
| North London | - | 1 | £70,000 | - | |
| C England |
|||||
C
Co-occurring Skills and Capabilities in London by Category
The follow tables expand on the table above by listing co-occurrences grouped by category. The same employment type, locality and period is covered with up to 20 co-occurrences shown in each of the following categories:
|
|
||||||||||||||||||||||||||||||||||||||||||||||||||||||||||||||||||||||||||||||||||||||||||||||||||||||||||||||||||||||||||||||
|
|
||||||||||||||||||||||||||||||||||||||||||||||||||||||||||||||||||||||||||||||||||||||||||||||||||||||||||||||||||||||||||||||
|
|
||||||||||||||||||||||||||||||||||||||||||||||||||||||||||||||||||||||||||||||||||||||||||||||||||||||||||||||||||||||||||||||
|
|
||||||||||||||||||||||||||||||||||||||||||||||||||||||||||||||||||||||||||||||||||||||||||||||||||||||||||||||||||||||||||||||
|
|
||||||||||||||||||||||||||||||||||||||||||||||||||||||||||||||||||||||||||||||||||||||||||||||||||||||||||||||||||||||||||||||
|
|
||||||||||||||||||||||||||||||||||||||||||||||||||||||||||||||||||||||||||||||||||||||||||||||||||||||||||||||||||||||||||||||
|
|
||||||||||||||||||||||||||||||||||||||||||||||||||||||||||||||||||||||||||||||||||||||||||||||||||||||||||||||||||||||||||||||
|
|
||||||||||||||||||||||||||||||||||||||||||||||||||||||||||||||||||||||||||||||||||||||||||||||||||||||||||||||||||||||||||||||
|
|
||||||||||||||||||||||||||||||||||||||||||||||||||||||||||||||||||||||||||||||||||||||||||||||||||||||||||||||||||||||||||||||
|
|||||||||||||||||||||||||||||||||||||||||||||||||||||||||||||||||||||||||||||||||||||||||||||||||||||||||||||||||||||||||||||||
