Legacy Systems Jobs in the UK excluding London

Legacy System
UK > UK excluding London

The table below looks at the prevalence of the term Legacy Systems in permanent job vacancies in the UK excluding London. Included is a benchmarking guide to the salaries offered in vacancies that cited Legacy Systems over the 6 months leading up to 18 May 2025, comparing them to the same period in the previous two years.

6 months to
18 May 2025
Same period 2024 Same period 2023
Rank 386 478 443
Rank change year-on-year +92 -35 +64
Permanent jobs citing Legacy Systems 213 301 341
As % of all permanent jobs advertised in the UK excluding London 0.53% 0.42% 0.58%
As % of the Miscellaneous category 1.59% 1.25% 1.37%
Number of salaries quoted 140 165 190
10th Percentile £38,750 £36,250 £33,750
25th Percentile £45,000 £41,375 £42,500
Median annual salary (50th Percentile) £57,500 £52,500 £55,000
Median % change year-on-year +9.52% -4.55% +4.76%
75th Percentile £70,938 £68,750 £70,000
90th Percentile £97,625 £80,750 £92,500
UK median annual salary £57,500 £60,000 £66,603
% change year-on-year -4.17% -9.91% +11.01%

All Generic Skills
UK excluding London

Legacy Systems falls under the General and Transferable Skills category. For comparison with the information above, the following table provides summary statistics for all permanent job vacancies requiring generic IT skills in the UK excluding London.

Permanent vacancies with a requirement for generic IT skills 13,411 24,153 24,928
As % of all permanent jobs advertised in the UK excluding London 33.64% 33.77% 42.24%
Number of salaries quoted 6,122 15,207 11,097
10th Percentile £28,800 £26,250 £31,250
25th Percentile £37,500 £35,000 £40,250
Median annual salary (50th Percentile) £54,975 £50,000 £55,000
Median % change year-on-year +9.95% -9.09% +4.76%
75th Percentile £67,500 £65,000 £70,000
90th Percentile £80,000 £80,000 £85,000
UK median annual salary £60,000 £55,000 £65,000
% change year-on-year +9.09% -15.38% +4.00%

Legacy Systems
Job Vacancy Trend in the UK excluding London

Job postings citing Legacy Systems as a proportion of all IT jobs advertised in the UK excluding London.
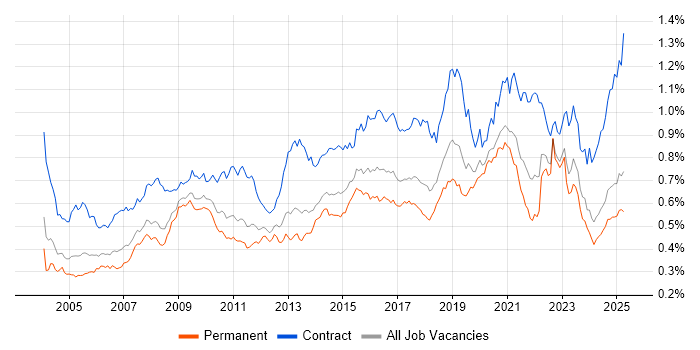
Job vacancy trend for Legacy Systems in the UK excluding London

Legacy Systems
Salary Trend in the UK excluding London

3-month moving average salary quoted in jobs citing Legacy Systems in the UK excluding London.

Salary trend for Legacy Systems in the UK excluding London

Legacy Systems
Salary Histogram in the UK excluding London

Salary distribution for jobs citing Legacy Systems in the UK excluding London over the 6 months to 18 May 2025.

Salary histogram for Legacy Systems in the UK excluding London

Legacy Systems
Job Locations in the UK excluding London

The table below looks at the demand and provides a guide to the median salaries quoted in IT jobs citing Legacy Systems within the UK excluding London region over the 6 months to 18 May 2025. The 'Rank Change' column provides an indication of the change in demand within each location based on the same 6 month period last year.

Location Rank Change
on Same Period
Last Year
Matching
Permanent
IT Job Ads
Median Salary
Past 6 Months
Median Salary
% Change
on Same Period
Last Year
Live
Jobs
Midlands +68 71 £45,000 -10.00% 56
West Midlands +71 61 £45,000 -10.00% 40
South East +77 59 £57,500 +9.52% 114
North of England +13 42 £57,500 +4.55% 68
North West -11 30 £57,500 +4.55% 34
South West +116 23 £87,500 +29.63% 43
Yorkshire +58 11 £65,000 +68.83% 22
East Midlands +4 10 £48,750 +25.81% 14
Scotland +77 7 £51,000 -30.85% 27
East of England +29 7 £68,454 +95.58% 26
Northern Ireland +38 2 £30,000 -36.84% 3
Wales +31 2 £47,500 - 11
North East +22 1 £29,500 -46.36% 13
Legacy Systems
UK

Legacy Systems
Co-occurring Skills and Capabilities in the UK excluding London by Category

The follow tables expand on the table above by listing co-occurrences grouped by category. The same employment type, locality and period is covered with up to 20 co-occurrences shown in each of the following categories:

Application Platforms
1 7 (3.29%) Microsoft Exchange
1 7 (3.29%) SharePoint
2 6 (2.82%) Apache Airflow
3 5 (2.35%) Confluence
4 4 (1.88%) JBoss
4 4 (1.88%) Luigi
5 2 (0.94%) Apache
6 1 (0.47%) Apache Spark
6 1 (0.47%) IIS
6 1 (0.47%) NetWeaver
Applications
1 13 (6.10%) Microsoft Excel
2 4 (1.88%) Microsoft PowerPoint
3 2 (0.94%) Microsoft Office
Business Applications
1 23 (10.80%) Oracle EBS
2 17 (7.98%) NetSuite
3 5 (2.35%) SAP S/4HANA
4 3 (1.41%) Dynamics AX
4 3 (1.41%) Endur
5 2 (0.94%) Dynamics CRM
5 2 (0.94%) Infor M3
5 2 (0.94%) SAP CO
5 2 (0.94%) SAP FI
5 2 (0.94%) SAP FI/CO
5 2 (0.94%) SAP MDG
6 1 (0.47%) Oracle Payables
Cloud Services
1 58 (27.23%) Azure
2 34 (15.96%) AWS
3 25 (11.74%) GCP
4 19 (8.92%) Power Platform
5 15 (7.04%) SaaS
6 12 (5.63%) Snowflake
7 10 (4.69%) Microsoft 365
7 10 (4.69%) PowerApps
8 8 (3.76%) Dynamics 365
9 6 (2.82%) dbt
9 6 (2.82%) npm
9 6 (2.82%) OpenShift
10 5 (2.35%) Azure Logic Apps
10 5 (2.35%) Azure Service Bus
10 5 (2.35%) Azure Synapse Analytics
11 4 (1.88%) AWS IoT
11 4 (1.88%) Pulumi
12 3 (1.41%) Azure Functions
12 3 (1.41%) Power Automate
12 3 (1.41%) Serverless
Communications & Networking
1 7 (3.29%) Firewall
2 6 (2.82%) DHCP
2 6 (2.82%) DNS
2 6 (2.82%) Network Security
2 6 (2.82%) Remote Desktop
2 6 (2.82%) SMTP
3 2 (0.94%) LoRaWAN
4 1 (0.47%) Ethernet
4 1 (0.47%) HTTP
4 1 (0.47%) LAN
4 1 (0.47%) OSPF
4 1 (0.47%) VPN
4 1 (0.47%) WAN
4 1 (0.47%) Wireless
Database & Business Intelligence
1 22 (10.33%) Oracle ODI
2 20 (9.39%) SQL Server
3 15 (7.04%) NoSQL
4 11 (5.16%) Power BI
5 10 (4.69%) BigQuery
5 10 (4.69%) MySQL
6 9 (4.23%) Amazon Redshift
7 7 (3.29%) SQL Server Integration Services
8 6 (2.82%) Amazon RDS
8 6 (2.82%) MongoDB
9 5 (2.35%) Data Warehouse
9 5 (2.35%) Oracle Database
9 5 (2.35%) PostgreSQL
10 4 (1.88%) SQL Server Reporting Services
10 4 (1.88%) Tableau
10 4 (1.88%) TimescaleDB
11 3 (1.41%) Azure SQL Database
11 3 (1.41%) Data Lake
11 3 (1.41%) Qlik Sense
11 3 (1.41%) Relational Database
Development Applications
1 19 (8.92%) Git
2 8 (3.76%) JIRA
3 6 (2.82%) Cucumber
3 6 (2.82%) Cypress.io
3 6 (2.82%) Sonatype Nexus
3 6 (2.82%) webpack
4 3 (1.41%) PHPUnit
4 3 (1.41%) Subversion
5 2 (0.94%) Checkstyle
5 2 (0.94%) Jenkins
5 2 (0.94%) SonarQube
5 2 (0.94%) Visual Studio
6 1 (0.47%) ERwin
6 1 (0.47%) LSMW
6 1 (0.47%) Moq
6 1 (0.47%) MSTest
6 1 (0.47%) NUnit
6 1 (0.47%) Oracle APEX
6 1 (0.47%) Oracle Forms
6 1 (0.47%) xUnit.net
General
1 86 (40.38%) Social Skills
2 62 (29.11%) Finance
3 53 (24.88%) Analytical Skills
4 43 (20.19%) Law
5 35 (16.43%) Manufacturing
6 21 (9.86%) Electronics
7 13 (6.10%) Public Sector
8 7 (3.29%) Banking
8 7 (3.29%) Inclusion and Diversity
9 5 (2.35%) Legal
9 5 (2.35%) Presentation Skills
10 4 (1.88%) Documentation Skills
10 4 (1.88%) Military
10 4 (1.88%) Retail
11 3 (1.41%) Local Government
12 2 (0.94%) Influencing Skills
12 2 (0.94%) Marketing
13 1 (0.47%) Agriculture
13 1 (0.47%) Aviation
13 1 (0.47%) Organisational Skills
Job Titles
1 49 (23.00%) Developer
2 43 (20.19%) Lead
3 28 (13.15%) Consultant
4 25 (11.74%) Technical Consultant
5 20 (9.39%) Analyst
5 20 (9.39%) Technical Leader
6 19 (8.92%) Architect
7 16 (7.51%) Senior
8 15 (7.04%) Data Consultant
8 15 (7.04%) Data Migration Consultant
8 15 (7.04%) Migration Consultant
8 15 (7.04%) Oracle Consultant
8 15 (7.04%) Oracle Data Migration Consultant
8 15 (7.04%) Oracle Technical Consultant
9 12 (5.63%) Business Analyst
10 10 (4.69%) .NET Developer
10 10 (4.69%) Data Engineer
10 10 (4.69%) NetSuite Consultant
10 10 (4.69%) Solutions Architect
11 9 (4.23%) Systems Analyst
Libraries, Frameworks & Software Standards
1 26 (12.21%) .NET
2 22 (10.33%) Oracle Fusion
3 18 (8.45%) HTML
3 18 (8.45%) REST
4 17 (7.98%) RESTful
5 15 (7.04%) SOAP
6 13 (6.10%) React
6 13 (6.10%) XML
7 10 (4.69%) Node.js
7 10 (4.69%) Restlet
7 10 (4.69%) Web Services
8 9 (4.23%) Jest
9 8 (3.76%) CSS
10 7 (3.29%) WPF
11 6 (2.82%) .NET Framework
11 6 (2.82%) Blazor
11 6 (2.82%) Spring Boot
12 4 (1.88%) .NET Core
12 4 (1.88%) JSON
12 4 (1.88%) NestJS
Miscellaneous
1 33 (15.49%) Data Structures
2 25 (11.74%) IoT
3 20 (9.39%) Manufacturing Execution System
3 20 (9.39%) SCADA
4 14 (6.57%) Cloud Native
5 12 (5.63%) Greenfield Project
6 9 (4.23%) Clustering
6 9 (4.23%) Legacy Applications
7 7 (3.29%) Hybrid Cloud
7 7 (3.29%) Public Cloud
7 7 (3.29%) Taxonomies
8 6 (2.82%) Distributed Applications
8 6 (2.82%) PKI
9 5 (2.35%) Legacy Code
9 5 (2.35%) Renewable Energy
10 4 (1.88%) Distributed Systems
10 4 (1.88%) Enterprise Software
11 3 (1.41%) Distributed Architecture
11 3 (1.41%) Management Information System
11 3 (1.41%) Product Ownership
Operating Systems
1 11 (5.16%) Windows
2 8 (3.76%) Windows Server
3 7 (3.29%) Linux
4 3 (1.41%) Windows 10
5 1 (0.47%) Windows Server 2003
Processes & Methodologies
1 72 (33.80%) Problem-Solving
2 69 (32.39%) Migration
3 53 (24.88%) Data Migration
4 42 (19.72%) Agile
4 42 (19.72%) ETL
5 33 (15.49%) ERP
6 29 (13.62%) Data Cleansing
6 29 (13.62%) Stakeholder Management
7 28 (13.15%) Data Modelling
8 27 (12.68%) Data Mapping
8 27 (12.68%) Mentoring
9 26 (12.21%) Change Management
9 26 (12.21%) Validation
10 22 (10.33%) CI/CD
10 22 (10.33%) Roadmaps
11 21 (9.86%) Analytics
11 21 (9.86%) Project Management
12 20 (9.39%) Data Collection
12 20 (9.39%) Mechatronics
12 20 (9.39%) Software Engineering
Programming Languages
1 61 (28.64%) SQL
2 34 (15.96%) JavaScript
3 27 (12.68%) C#
4 23 (10.80%) PL/SQL
5 22 (10.33%) Java
6 12 (5.63%) Python
7 10 (4.69%) TypeScript
8 9 (4.23%) PowerShell
9 7 (3.29%) PHP
10 4 (1.88%) T-SQL
10 4 (1.88%) VB.NET
11 3 (1.41%) Delphi
11 3 (1.41%) Julia
11 3 (1.41%) R
11 3 (1.41%) VBA
11 3 (1.41%) XAML
12 2 (0.94%) Bash
13 1 (0.47%) C++
13 1 (0.47%) Ruby
13 1 (0.47%) Rust
Qualifications
1 14 (6.57%) Degree
2 12 (5.63%) Security Cleared
3 8 (3.76%) DV Cleared
4 4 (1.88%) Azure Certification
5 3 (1.41%) ACCA
5 3 (1.41%) TOGAF Certification
6 2 (0.94%) AWS Certification
6 2 (0.94%) Computer Science Degree
6 2 (0.94%) Master's Degree
6 2 (0.94%) Microsoft Certification
6 2 (0.94%) MOS
7 1 (0.47%) BPSS Clearance
7 1 (0.47%) MBA
7 1 (0.47%) PhD
7 1 (0.47%) Postgraduate
7 1 (0.47%) SC Cleared
Quality Assurance & Compliance
1 13 (6.10%) Data Quality
2 9 (4.23%) QA
3 6 (2.82%) Accessibility
4 3 (1.41%) SLA
5 2 (0.94%) GDPR
5 2 (0.94%) PMO
6 1 (0.47%) Def Stans
6 1 (0.47%) DO-178B
6 1 (0.47%) IEC 61508
6 1 (0.47%) Sarbanes-Oxley
System Software
1 25 (11.74%) Docker
2 9 (4.23%) Active Directory
2 9 (4.23%) VMware Infrastructure
3 8 (3.76%) Hyper-V
3 8 (3.76%) vSphere
4 6 (2.82%) BitLocker
4 6 (2.82%) Microsoft App-V
4 6 (2.82%) Terminal Services
4 6 (2.82%) VMware ESXi
Systems Management
1 10 (4.69%) Kubernetes
2 7 (3.29%) Terraform
3 6 (2.82%) Ansible
3 6 (2.82%) Nagios
3 6 (2.82%) Puppet
3 6 (2.82%) vCenter Server
3 6 (2.82%) vMotion
4 1 (0.47%) CSIRT
4 1 (0.47%) Istio
4 1 (0.47%) Jamf Pro
4 1 (0.47%) Microsoft Intune
4 1 (0.47%) SCCM
Vendors
1 49 (23.00%) Microsoft
2 34 (15.96%) Oracle
3 20 (9.39%) Rockwell
3 20 (9.39%) Siemens
4 12 (5.63%) Google
4 12 (5.63%) Salesforce
5 9 (4.23%) VMware
6 8 (3.76%) IBM
6 8 (3.76%) SAP
7 7 (3.29%) Red Hat
8 6 (2.82%) Citrix
8 6 (2.82%) HP
8 6 (2.82%) Symantec
9 3 (1.41%) Cisco
9 3 (1.41%) OpenLink
10 2 (0.94%) Informatica
10 2 (0.94%) Juniper
10 2 (0.94%) McAfee
10 2 (0.94%) NetApp
10 2 (0.94%) ServiceNow