VLAN Jobs in the UK excluding London

Virtual LAN (VLAN)
UK > UK excluding London

The following table provides summary statistics for permanent job vacancies advertised in the UK excluding London with a requirement for VLAN skills. Included is a benchmarking guide to the salaries offered in vacancies that have cited VLAN over the 6 months to 3 May 2024 with a comparison to the same period in the previous 2 years.

6 months to
3 May 2024
Same period 2023 Same period 2022
Rank 351 440 479
Rank change year-on-year +89 +39 -174
Permanent jobs citing VLAN 505 365 420
As % of all permanent jobs advertised in the UK excluding London 0.72% 0.59% 0.59%
As % of the Communications & Networking category 5.14% 3.32% 3.83%
Number of salaries quoted 445 296 386
10th Percentile £26,000 £27,500 £27,500
25th Percentile £31,000 £32,000 £30,000
Median annual salary (50th Percentile) £37,500 £38,000 £40,000
Median % change year-on-year -1.32% -5.00% -5.88%
75th Percentile £47,500 £47,500 £52,500
90th Percentile £57,500 £58,750 £72,500
UK median annual salary £40,313 £42,000 £42,500
% change year-on-year -4.02% -1.18% -5.56%

All Communications and Computer Networking Skills
UK excluding London

VLAN is in the Communications and Computer Networking category. The following table is for comparison with the above and provides summary statistics for all permanent job vacancies advertised in the UK excluding London with a requirement for communications or computer networking skills.

Permanent vacancies with a requirement for communications or computer networking skills 9,831 11,009 10,969
As % of all permanent jobs advertised in the UK excluding London 13.96% 17.91% 15.44%
Number of salaries quoted 7,131 4,846 6,519
10th Percentile £25,750 £26,250 £26,750
25th Percentile £31,250 £31,576 £33,000
Median annual salary (50th Percentile) £43,750 £45,000 £45,000
Median % change year-on-year -2.78% - -
75th Percentile £57,500 £60,000 £60,207
90th Percentile £68,750 £75,000 £73,750
UK median annual salary £48,000 £50,000 £52,500
% change year-on-year -4.00% -4.76% +5.00%

VLAN
Job Vacancy Trend in the UK excluding London

Job postings citing VLAN as a proportion of all IT jobs advertised in the UK excluding London.
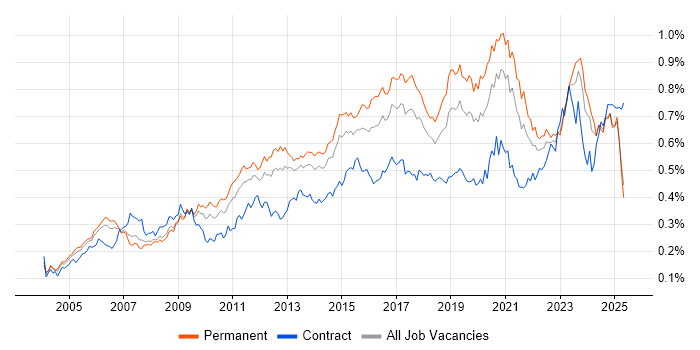
Job vacancy trend for VLAN in the UK excluding London

VLAN
Salary Trend in the UK excluding London

3-month moving average salary quoted in jobs citing VLAN in the UK excluding London.

Salary trend for VLAN in the UK excluding London

VLAN
Salary Histogram in the UK excluding London

Salary distribution for jobs citing VLAN in the UK excluding London over the 6 months to 3 May 2024.

Salary histogram for VLAN in the UK excluding London

VLAN
Job Locations in the UK excluding London

The table below looks at the demand and provides a guide to the median salaries quoted in IT jobs citing VLAN within the UK excluding London region over the 6 months to 3 May 2024. The 'Rank Change' column provides an indication of the change in demand within each location based on the same 6 month period last year.

Location Rank Change
on Same Period
Last Year
Matching
Permanent
IT Job Ads
Median Salary
Past 6 Months
Median Salary
% Change
on Same Period
Last Year
Live
Jobs
South East +23 151 £35,000 -7.28% 24
Midlands +98 134 £39,000 -8.24% 33
North of England +51 80 £37,500 -11.76% 31
West Midlands +65 71 £39,750 -11.67% 20
East Midlands +39 63 £37,500 +2.74% 13
East of England +28 58 £40,000 +11.11% 15
South West -18 51 £37,500 +7.14% 22
Yorkshire +88 36 £37,500 +14.50% 11
North West -15 28 £45,000 - 16
Scotland -54 19 £38,000 +22.58% 3
North East +9 16 £29,500 -41.00% 4
Wales +15 10 £44,886 +12.22% 4
Northern Ireland +30 2 £32,500 -
VLAN
UK

VLAN
Co-occurring Skills and Capabilities in the UK excluding London by Category

The follow tables expand on the table above by listing co-occurrences grouped by category. The same employment type, locality and period is covered with up to 20 co-occurrences shown in each of the following categories:

Application Platforms
1 120 (23.76%) SharePoint
2 83 (16.44%) Microsoft Exchange
3 7 (1.39%) OpenStack
4 5 (0.99%) IIS
4 5 (0.99%) SAS
5 4 (0.79%) Confluence
5 4 (0.79%) Exchange Server 2010
6 3 (0.59%) Exchange Server 2007
7 2 (0.40%) Exchange Server 2003
7 2 (0.40%) Exchange Server 2013
7 2 (0.40%) Skype for Business
8 1 (0.20%) JOnAS
Applications
1 92 (18.22%) Microsoft Office
2 5 (0.99%) MS Visio
3 4 (0.79%) Trello
4 3 (0.59%) Microsoft Excel
5 2 (0.40%) CATIA
5 2 (0.40%) Microsoft PowerPoint
5 2 (0.40%) NASTRAN
Business Applications
1 4 (0.79%) Sage 200
2 2 (0.40%) Teamcenter
3 1 (0.20%) Dynamics CRM
3 1 (0.20%) Dynamics NAV
3 1 (0.20%) SAP ERP
3 1 (0.20%) SAP S/4HANA
Cloud Services
1 298 (59.01%) Microsoft 365
2 252 (49.90%) Azure
3 96 (19.01%) Entra ID
4 66 (13.07%) AWS
5 51 (10.10%) OneDrive
6 20 (3.96%) Google Workspace
7 14 (2.77%) GCP
8 11 (2.18%) Mimecast
9 10 (1.98%) SaaS
10 8 (1.58%) Azure Sentinel
11 7 (1.39%) Dynamics 365
11 7 (1.39%) WhatsApp
12 6 (1.19%) Cloud Computing
13 5 (0.99%) Nutanix
14 4 (0.79%) Slack
15 3 (0.59%) IaaS
15 3 (0.59%) Power Platform
16 2 (0.40%) Amazon S3
16 2 (0.40%) AWS CloudFormation
16 2 (0.40%) OpenDNS
Communications & Networking
1 292 (57.82%) Firewall
2 210 (41.58%) DNS
3 197 (39.01%) VPN
4 187 (37.03%) WAN
5 166 (32.87%) DHCP
6 138 (27.33%) LAN
7 127 (25.15%) TCP/IP
8 88 (17.43%) Wi-Fi
9 67 (13.27%) SAN
10 64 (12.67%) Wireless
11 56 (11.09%) OSPF
12 53 (10.50%) VoIP
13 50 (9.90%) BGP
14 42 (8.32%) MPLS
15 38 (7.52%) Network Security
16 33 (6.53%) IPsec
16 33 (6.53%) SD-WAN
17 28 (5.54%) HSRP
18 26 (5.15%) Internet
18 26 (5.15%) NAS
Database & Business Intelligence
1 20 (3.96%) Amazon RDS
2 16 (3.17%) SQL Server
3 5 (0.99%) Azure SQL Database
3 5 (0.99%) NoSQL
4 4 (0.79%) DB2
5 3 (0.59%) MySQL
5 3 (0.59%) Power BI
6 2 (0.40%) DTS
6 2 (0.40%) SQLPlus
7 1 (0.20%) Elasticsearch
7 1 (0.20%) SAP HANA
Development Applications
1 5 (0.99%) JIRA
2 1 (0.20%) Git
2 1 (0.20%) Jenkins
2 1 (0.20%) Selenium
General
1 155 (30.69%) Social Skills
2 48 (9.50%) Analytical Skills
3 33 (6.53%) Telecoms
4 27 (5.35%) Finance
5 17 (3.37%) Documentation Skills
6 15 (2.97%) Retail
7 14 (2.77%) Manufacturing
8 13 (2.57%) Inclusion and Diversity
8 13 (2.57%) Law
9 11 (2.18%) Automotive
10 10 (1.98%) Legal
11 9 (1.78%) Police
12 8 (1.58%) Organisational Skills
13 5 (0.99%) Aerospace
13 5 (0.99%) Local Government
13 5 (0.99%) Public Sector
14 4 (0.79%) Health Technology
14 4 (0.79%) Tech for Good
15 2 (0.40%) Influencing Skills
15 2 (0.40%) Marketing
Job Titles
1 108 (21.39%) Support Engineer
2 89 (17.62%) Network Engineer
3 88 (17.43%) IT Support
4 86 (17.03%) IT Engineer
5 78 (15.45%) Senior
6 77 (15.25%) Infrastructure Engineer
7 50 (9.90%) IT Support Engineer
8 41 (8.12%) Analyst
8 41 (8.12%) IT Technician
9 40 (7.92%) 3rd Line Engineer
10 39 (7.72%) 2nd Line Support
11 33 (6.53%) 2nd Line Engineer
12 32 (6.34%) 3rd Line Support
13 27 (5.35%) IT Manager
14 25 (4.95%) 2nd Line Support Engineer
15 24 (4.75%) 3rd Line Support Engineer
16 23 (4.55%) IT Infrastructure Engineer
16 23 (4.55%) Network Support
17 19 (3.76%) Systems Engineer
18 18 (3.56%) Systems Administrator
Libraries, Frameworks & Software Standards
1 19 (3.76%) 802.1X
2 6 (1.19%) LAMP
3 4 (0.79%) LEMP Stack
4 3 (0.59%) REST
4 3 (0.59%) SOAP
4 3 (0.59%) Web Services
5 2 (0.40%) Elastic Stack
5 2 (0.40%) V-Ray
6 1 (0.20%) JSON
6 1 (0.20%) LDAP
Miscellaneous
1 41 (8.12%) Driving Licence
2 33 (6.53%) Data Centre
3 18 (3.56%) Onboarding
4 15 (2.97%) Clustering
5 14 (2.77%) Hybrid Cloud
6 12 (2.38%) Management Information System
7 11 (2.18%) FMCG
7 11 (2.18%) Self-Motivation
8 10 (1.98%) Replication
9 6 (1.19%) Cyberattack
10 5 (0.99%) Algorithms
10 5 (0.99%) CCTV
10 5 (0.99%) Client/Server
10 5 (0.99%) Data Structures
10 5 (0.99%) iPhone
10 5 (0.99%) PMI
11 4 (0.79%) Cloud Native
11 4 (0.79%) Product Ownership
12 3 (0.59%) Renewable Energy
12 3 (0.59%) SCADA
Operating Systems
1 289 (57.23%) Windows
2 187 (37.03%) Windows Server
3 78 (15.45%) Windows 10
4 76 (15.05%) Linux
5 51 (10.10%) Windows Server 2019
6 46 (9.11%) Android
7 30 (5.94%) Windows Server 2016
8 28 (5.54%) Apple iOS
9 23 (4.55%) Windows Server 2012
10 19 (3.76%) Windows Server 2008
11 15 (2.97%) Mac OS
12 13 (2.57%) Unix
13 11 (2.18%) Mac OS X
14 10 (1.98%) Ubuntu
15 8 (1.58%) Windows 8
16 7 (1.39%) Debian
16 7 (1.39%) Windows 7
17 4 (0.79%) VMS
18 3 (0.59%) CentOS
18 3 (0.59%) Windows Vista
Processes & Methodologies
1 106 (20.99%) Problem-Solving
2 99 (19.60%) Customer Service
3 82 (16.24%) Infrastructure Engineering
4 55 (10.89%) ITIL
5 49 (9.70%) Cybersecurity
6 39 (7.72%) Continuous Improvement
7 38 (7.52%) Kalman Filter
8 37 (7.33%) Disaster Recovery
8 37 (7.33%) Mentoring
9 30 (5.94%) Service Delivery
10 28 (5.54%) Project Delivery
11 26 (5.15%) Computer Science
11 26 (5.15%) Roadmaps
12 23 (4.55%) Migration
12 23 (4.55%) Patch Management
13 22 (4.36%) Network Design
14 21 (4.16%) Collaborative Working
14 21 (4.16%) Technical Leadership
15 19 (3.76%) Network Architecture
16 18 (3.56%) Server Management
Programming Languages
1 74 (14.65%) PowerShell
2 49 (9.70%) SQL
3 16 (3.17%) Python
4 8 (1.58%) Bash
5 6 (1.19%) Shell Script
6 1 (0.20%) C
6 1 (0.20%) C++
Qualifications
1 114 (22.57%) Cisco Certification
2 78 (15.45%) CCNA
3 66 (13.07%) Degree
4 65 (12.87%) Microsoft Certification
5 49 (9.70%) CCNP
6 37 (7.33%) Security Cleared
7 34 (6.73%) MCSE
8 29 (5.74%) Computer Science Degree
9 21 (4.16%) SC Cleared
10 20 (3.96%) Network+ Certification
11 18 (3.56%) CCIE
12 16 (3.17%) Azure Certification
13 15 (2.97%) MCSA
14 13 (2.57%) MCITP
15 12 (2.38%) A+ Certification
15 12 (2.38%) MCP
16 8 (1.58%) DBS Check
17 7 (1.39%) CCDP
17 7 (1.39%) CCIE Routing and Switching
18 6 (1.19%) AWS Certification
Quality Assurance & Compliance
1 16 (3.17%) GDPR
2 15 (2.97%) SLA
3 13 (2.57%) Cyber Essentials
4 8 (1.58%) QA
5 5 (0.99%) ISO/IEC 20000
6 4 (0.79%) Cyber Essentials PLUS
7 3 (0.59%) Disclosure Scotland
7 3 (0.59%) ISO/IEC 27001
7 3 (0.59%) NIST
System Software
1 249 (49.31%) Active Directory
2 153 (30.30%) Hyper-V
3 120 (23.76%) VMware Infrastructure
4 24 (4.75%) Virtual Machines
5 20 (3.96%) vSphere
6 9 (1.78%) Virtual Desktop
6 9 (1.78%) VMware ESXi
7 7 (1.39%) Firmware
7 7 (1.39%) Virtual Servers
8 6 (1.19%) NFS
9 4 (0.79%) Docker
9 4 (0.79%) Microsoft Virtual Server
9 4 (0.79%) Terminal Services
10 2 (0.40%) Citrix Hypervisor
10 2 (0.40%) pfSense
10 2 (0.40%) Terminal Server
10 2 (0.40%) VMware Server
11 1 (0.20%) KVM
11 1 (0.20%) VMware NSX
Systems Management
1 92 (18.22%) Microsoft Intune
2 31 (6.14%) SCCM
3 16 (3.17%) Jamf Pro
4 15 (2.97%) WSUS
5 14 (2.77%) Nagios
5 14 (2.77%) SmoothWall
6 13 (2.57%) Autotask
6 13 (2.57%) FortiGate
7 10 (1.98%) Ansible
7 10 (1.98%) Failover Clustering
8 7 (1.39%) ZABBIX
9 5 (0.99%) OfficeScan
9 5 (0.99%) Puppet
9 5 (0.99%) Single Sign-On
10 3 (0.59%) Active Directory Federation Services
10 3 (0.59%) Icinga
10 3 (0.59%) PaperCut
11 2 (0.40%) Kubernetes
11 2 (0.40%) Terraform
11 2 (0.40%) vCenter Server
Vendors
1 277 (54.85%) Microsoft
2 173 (34.26%) Cisco
3 159 (31.49%) VMware
4 52 (10.30%) Veeam
5 35 (6.93%) Meraki
6 32 (6.34%) Apple
6 32 (6.34%) Juniper
7 26 (5.15%) Fortinet
8 23 (4.55%) Citrix
9 22 (4.36%) Google
9 22 (4.36%) SonicWALL
10 17 (3.37%) Datto
11 16 (3.17%) Avaya
11 16 (3.17%) Dell
12 15 (2.97%) Aruba
12 15 (2.97%) Barracuda Networks
12 15 (2.97%) Draytek
13 13 (2.57%) CheckPoint
13 13 (2.57%) HP
13 13 (2.57%) Sophos