VB Jobs in England

Microsoft Visual Basic (VB)
UK > England

The following table provides summary statistics for permanent job vacancies advertised in England with a requirement for VB skills. Included is a benchmarking guide to the salaries offered in vacancies that have cited VB over the 6 months to 10 May 2024 with a comparison to the same period in the previous 2 years.

6 months to
10 May 2024
Same period 2023 Same period 2022
Rank 504 611 706
Rank change year-on-year +107 +95 -163
Permanent jobs citing VB 341 329 460
As % of all permanent jobs advertised in England 0.40% 0.37% 0.35%
As % of the Programming Languages category 1.23% 0.84% 0.65%
Number of salaries quoted 239 260 305
10th Percentile £29,850 £37,500 £32,500
25th Percentile £37,500 £47,500 £40,000
Median annual salary (50th Percentile) £48,500 £57,500 £50,000
Median % change year-on-year -15.65% +15.00% +12.36%
75th Percentile £59,000 £115,000 £60,000
90th Percentile £62,750 £138,750 £132,500
UK median annual salary £48,500 £56,159 £47,500
% change year-on-year -13.64% +18.23% +11.11%

All Programming Languages
England

VB is in the Programming Languages category. The following table is for comparison with the above and provides summary statistics for all permanent job vacancies advertised in England with a requirement for coding skills.

Permanent vacancies with a requirement for coding skills 27,615 38,982 71,144
As % of all permanent jobs advertised in England 32.16% 43.34% 53.52%
Number of salaries quoted 22,462 25,076 38,912
10th Percentile £35,475 £40,000 £37,500
25th Percentile £45,000 £50,000 £46,250
Median annual salary (50th Percentile) £60,000 £65,000 £62,500
Median % change year-on-year -7.69% +4.00% +8.70%
75th Percentile £80,000 £87,500 £83,750
90th Percentile £100,000 £110,000 £100,000
UK median annual salary £60,000 £65,000 £62,500
% change year-on-year -7.69% +4.00% +13.64%

VB
Job Vacancy Trend in England

Job postings citing VB as a proportion of all IT jobs advertised in England.
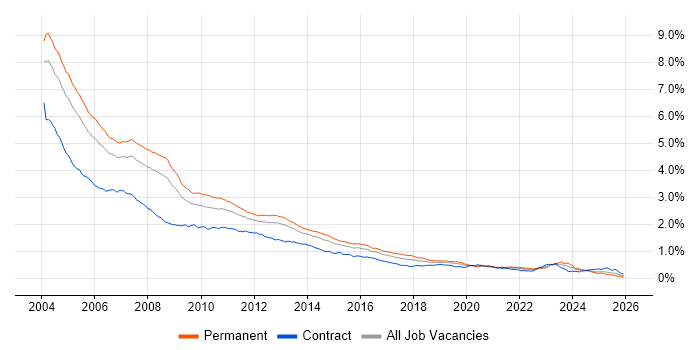
Job vacancy trend for VB in England

VB
Salary Trend in England

3-month moving average salary quoted in jobs citing VB in England.

Salary trend for VB in England

VB
Salary Histogram in England

Salary distribution for jobs citing VB in England over the 6 months to 10 May 2024.

Salary histogram for VB in England

VB
Job Locations in England

The table below looks at the demand and provides a guide to the median salaries quoted in IT jobs citing VB within the England region over the 6 months to 10 May 2024. The 'Rank Change' column provides an indication of the change in demand within each location based on the same 6 month period last year.

Location Rank Change
on Same Period
Last Year
Matching
Permanent
IT Job Ads
Median Salary
Past 6 Months
Median Salary
% Change
on Same Period
Last Year
Live
Jobs
Midlands +36 78 £50,000 +17.65% 19
North of England +36 64 £52,500 -4.34% 8
London +29 60 £62,500 -45.65% 17
South East +40 59 £54,000 +8.00% 14
East of England +57 47 £40,000 -15.79% 9
North West +28 45 £52,500 +50.00% 7
West Midlands +24 40 £55,000 +22.22% 14
East Midlands +12 38 £47,500 +18.75% 5
South West -20 33 £32,500 -35.00% 12
Yorkshire +48 16 £47,500 -22.36%
North East - 3 £47,500 - 1
VB
UK

VB
Co-occurring Skills and Capabilities in England by Category

The follow tables expand on the table above by listing co-occurrences grouped by category. The same employment type, locality and period is covered with up to 20 co-occurrences shown in each of the following categories:

Application Platforms
1 54 (15.84%) Microsoft Exchange
2 30 (8.80%) IIS
3 18 (5.28%) Apache
4 9 (2.64%) SharePoint
5 7 (2.05%) Apache Spark
6 2 (0.59%) CMS
6 2 (0.59%) Liferay
6 2 (0.59%) Magnolia
6 2 (0.59%) Sitecore CMS
6 2 (0.59%) WinCC
7 1 (0.29%) Alfresco
7 1 (0.29%) Confluence
7 1 (0.29%) Documentum
Applications
1 27 (7.92%) Microsoft Excel
2 24 (7.04%) Microsoft Office
3 3 (0.88%) Spreadsheet
4 2 (0.59%) Fusion 360
4 2 (0.59%) SOLIDWORKS
Business Applications
1 40 (11.73%) Endur
2 9 (2.64%) Shopify
3 7 (2.05%) OpenLink RightAngle
4 2 (0.59%) DELMIA
4 2 (0.59%) SAP MII
4 2 (0.59%) SAP S/4HANA
Cloud Services
1 75 (21.99%) Azure
2 31 (9.09%) Azure DevOps
3 30 (8.80%) Microsoft 365
4 25 (7.33%) Power Platform
5 22 (6.45%) Entra ID
6 20 (5.87%) Azure Monitor
7 14 (4.11%) Azure Storage
8 13 (3.81%) AWS
9 10 (2.93%) Power Automate
10 6 (1.76%) GitHub
11 5 (1.47%) Google Workspace
11 5 (1.47%) PowerApps
12 2 (0.59%) npm
12 2 (0.59%) PaaS
13 1 (0.29%) Azure Functions
13 1 (0.29%) Firebase
13 1 (0.29%) GCP
13 1 (0.29%) SaaS
13 1 (0.29%) Serverless
Communications & Networking
1 21 (6.16%) DNS
2 20 (5.87%) DHCP
3 14 (4.11%) Firewall
4 10 (2.93%) Internet
5 8 (2.35%) 5G
5 8 (2.35%) SD-WAN
5 8 (2.35%) WAN
6 5 (1.47%) HTTP
6 5 (1.47%) Wireless
7 4 (1.17%) FTP
8 2 (0.59%) Ethernet
9 1 (0.29%) HTTPS
9 1 (0.29%) Intranet
9 1 (0.29%) Network Security
9 1 (0.29%) Profibus
9 1 (0.29%) RS-232
Database & Business Intelligence
1 154 (45.16%) SQL Server
2 47 (13.78%) Relational Database
3 40 (11.73%) RDBMS
4 23 (6.74%) Power BI
5 21 (6.16%) PostgreSQL
6 19 (5.57%) MS Access
6 19 (5.57%) SQL Server Reporting Services
7 18 (5.28%) MongoDB
8 16 (4.69%) MySQL
9 13 (3.81%) SQL Server Integration Services
10 11 (3.23%) NoSQL
11 9 (2.64%) Data Warehouse
12 7 (2.05%) Big Data
13 5 (1.47%) Oracle Database
14 4 (1.17%) BusinessObjects
14 4 (1.17%) Elasticsearch
14 4 (1.17%) Tableau
15 2 (0.59%) Crystal Reports
15 2 (0.59%) DB2
15 2 (0.59%) DTS
Development Applications
1 44 (12.90%) Visual Studio
2 27 (7.92%) Jasmine
2 27 (7.92%) Karma Test Runner
3 18 (5.28%) JIRA
4 9 (2.64%) InstallShield
5 6 (1.76%) Dreamweaver
6 5 (1.47%) Bitbucket
6 5 (1.47%) Git
6 5 (1.47%) Jenkins
7 4 (1.17%) AdminStudio
7 4 (1.17%) MSI
8 2 (0.59%) Android Studio
8 2 (0.59%) Bower
8 2 (0.59%) gulp
8 2 (0.59%) Moq
8 2 (0.59%) SQL Server Management Studio (SSMS)
9 1 (0.29%) Cucumber
9 1 (0.29%) Cypress.io
9 1 (0.29%) SoapUI
9 1 (0.29%) TestNG
General
1 79 (23.17%) Social Skills
2 51 (14.96%) Analytical Skills
3 43 (12.61%) Games
4 40 (11.73%) Marketing
5 36 (10.56%) Finance
6 22 (6.45%) Retail
7 21 (6.16%) Manufacturing
8 11 (3.23%) Legal
9 10 (2.93%) Law
10 9 (2.64%) Aerospace
10 9 (2.64%) Electronics
11 8 (2.35%) Organisational Skills
11 8 (2.35%) Presentation Skills
12 7 (2.05%) Advertising
12 7 (2.05%) Inclusion and Diversity
13 5 (1.47%) Automotive
13 5 (1.47%) Police
14 4 (1.17%) Back Office
14 4 (1.17%) Documentation Skills
14 4 (1.17%) Pharmaceutical
Job Titles
1 116 (34.02%) Developer
2 61 (17.89%) Senior
3 32 (9.38%) Support Engineer
4 31 (9.09%) C# Developer
5 23 (6.74%) Software Engineer
6 22 (6.45%) Development Manager
7 21 (6.16%) Endur Manager
7 21 (6.16%) OpenLink Manager
7 21 (6.16%) Software Developer
8 20 (5.87%) Active Directory Specialist
8 20 (5.87%) Azure Specialist
8 20 (5.87%) Software Development Manager
8 20 (5.87%) Software Manager
9 18 (5.28%) .NET Developer
9 18 (5.28%) Analyst
9 18 (5.28%) Software Support Engineer
10 16 (4.69%) Lead
10 16 (4.69%) Senior Development Manager
10 16 (4.69%) Senior Manager
11 14 (4.11%) Endur Architect
Libraries, Frameworks & Software Standards
1 165 (48.39%) .NET
2 72 (21.11%) ASP.NET
3 69 (20.23%) XML
4 58 (17.01%) Web Services
5 56 (16.42%) JSON
6 50 (14.66%) HTML
7 47 (13.78%) REST
8 46 (13.49%) SOAP
9 42 (12.32%) AngularJS
10 27 (7.92%) RxJS
10 27 (7.92%) Sass
10 27 (7.92%) XML Schema
11 17 (4.99%) CSS
12 16 (4.69%) .NET Core
13 15 (4.40%) MFC
13 15 (4.40%) RESTful
14 14 (4.11%) .NET Framework
14 14 (4.11%) ARM Templates
15 13 (3.81%) HTML5
16 11 (3.23%) Entity Framework
Miscellaneous
1 40 (11.73%) Swaptions
2 34 (9.97%) Enterprise Software
3 30 (8.80%) PKI
4 23 (6.74%) Self-Motivation
5 14 (4.11%) SCADA
6 12 (3.52%) Clustering
7 9 (2.64%) EPoS
7 9 (2.64%) Legacy Applications
7 9 (2.64%) Virtual Team
8 8 (2.35%) Driving Licence
8 8 (2.35%) FPGA
8 8 (2.35%) GNSS
8 8 (2.35%) MicroBlaze
8 8 (2.35%) Mobile App
8 8 (2.35%) Smart Meter
8 8 (2.35%) VHDL
9 6 (1.76%) Legacy Systems
9 6 (1.76%) Operational Technology
10 5 (1.47%) Distributed Denial-of-Service
10 5 (1.47%) Smart Energy
Operating Systems
1 79 (23.17%) Windows
2 74 (21.70%) Linux
3 39 (11.44%) Windows Server
4 19 (5.57%) Windows Server 2016
4 19 (5.57%) Windows Server 2019
5 18 (5.28%) AIX
6 15 (4.40%) Windows Server 2012
7 11 (3.23%) Windows 10
8 10 (2.93%) Windows 7
9 6 (1.76%) Windows 8
10 5 (1.47%) Apple iOS
11 3 (0.88%) Red Hat Enterprise Linux
12 2 (0.59%) Android
Processes & Methodologies
1 73 (21.41%) Problem-Solving
2 64 (18.77%) Agile
3 62 (18.18%) SDLC
4 55 (16.13%) DevOps
5 54 (15.84%) Creative Thinking
6 44 (12.90%) Software Engineering
7 40 (11.73%) Business Transformation
7 40 (11.73%) Data Modelling
8 37 (10.85%) Project Management
9 36 (10.56%) Customer Service
10 33 (9.68%) Roadmaps
10 33 (9.68%) Strategic Roadmap
11 31 (9.09%) IT Strategy
11 31 (9.09%) Technology Strategy
11 31 (9.09%) User Acceptance Testing
11 31 (9.09%) Workshop Facilitation
12 30 (8.80%) Continuous Improvement
13 29 (8.50%) Data Science
13 29 (8.50%) Release Management
14 27 (7.92%) Unit Testing
Programming Languages
1 187 (54.84%) C#
2 176 (51.61%) SQL
3 78 (22.87%) JavaScript
4 65 (19.06%) VB.NET
5 60 (17.60%) Java
6 53 (15.54%) PowerShell
7 52 (15.25%) C
8 51 (14.96%) C++
9 46 (13.49%) T-SQL
10 45 (13.20%) VB6
11 38 (11.14%) VBScript
12 36 (10.56%) Python
12 36 (10.56%) TypeScript
13 22 (6.45%) VBA
14 16 (4.69%) PHP
15 15 (4.40%) Assembly Language
16 14 (4.11%) ActionScript
16 14 (4.11%) Bicep
17 11 (3.23%) Perl
18 9 (2.64%) Tcl
Qualifications
1 98 (28.74%) Degree
2 33 (9.68%) Security Cleared
3 25 (7.33%) DV Cleared
4 18 (5.28%) SC Cleared
5 14 (4.11%) Computer Science Degree
5 14 (4.11%) ITIL Foundation Certificate
6 10 (2.93%) HNC
7 8 (2.35%) HND
8 5 (1.47%) DBS Check
9 4 (1.17%) Master's Degree
9 4 (1.17%) PhD
10 3 (0.88%) MBA
Quality Assurance & Compliance
1 44 (12.90%) QA
2 9 (2.64%) SLA
3 5 (1.47%) Actionable Recommendations
3 5 (1.47%) GDPR
4 3 (0.88%) Accessibility
4 3 (0.88%) California Consumer Privacy Act
4 3 (0.88%) Data Quality
5 2 (0.59%) PCI DSS
System Software
1 45 (13.20%) Active Directory
2 15 (4.40%) Virtual Machines
3 14 (4.11%) Virtual Desktop
3 14 (4.11%) VMware Infrastructure
4 13 (3.81%) Docker
5 10 (2.93%) OpenSSH
5 10 (2.93%) VMware ESXi
5 10 (2.93%) vSphere
5 10 (2.93%) XenApp
6 8 (2.35%) Embedded Firmware
6 8 (2.35%) Firmware
7 4 (1.17%) Microsoft App-V
8 1 (0.29%) Hyper-V
Systems Management
1 20 (5.87%) Active Directory Federation Services
2 19 (5.57%) SCCM
3 18 (5.28%) Kubernetes
3 18 (5.28%) WSUS
4 14 (4.11%) Microsoft Intune
4 14 (4.11%) SCOM
5 10 (2.93%) IBM BigFix
5 10 (2.93%) PowerCLI
5 10 (2.93%) vCenter Server
6 2 (0.59%) Functional Safety
6 2 (0.59%) Microsoft Clustering
6 2 (0.59%) Wonderware InTouch
7 1 (0.29%) WMI
Vendors
1 126 (36.95%) Microsoft
2 70 (20.53%) Oracle
3 40 (11.73%) OpenLink
3 40 (11.73%) Sybase
3 40 (11.73%) TIBCO
4 14 (4.11%) VMware
5 10 (2.93%) Citrix
5 10 (2.93%) IBM
6 8 (2.35%) Altera
6 8 (2.35%) Green Hills
6 8 (2.35%) Motorola
6 8 (2.35%) SAP
6 8 (2.35%) Xilinx
7 7 (2.05%) Atlassian
7 7 (2.05%) Facebook
7 7 (2.05%) YouTube
8 6 (1.76%) Google
9 5 (1.47%) Apple
9 5 (1.47%) ServiceNow
9 5 (1.47%) Siemens