Creative Thinking Jobs in England

Creative Thinking
UK > England

The table below provides summary statistics for permanent job vacancies advertised in England requiring Creative Thinking skills. It includes a benchmarking guide to the annual salaries offered in vacancies that cited Creative Thinking over the 6 months leading up to 30 May 2025, comparing them to the same period in the previous two years.

6 months to
30 May 2025
Same period 2024 Same period 2023
Rank 165 270 290
Rank change year-on-year +105 +20 -14
Permanent jobs citing Creative Thinking 989 905 1,036
As % of all permanent jobs advertised in England 2.02% 1.01% 1.20%
As % of the Processes & Methodologies category 2.15% 1.20% 1.25%
Number of salaries quoted 93 339 363
10th Percentile £31,250 £28,498 £36,250
25th Percentile £45,500 £36,375 £50,329
Median annual salary (50th Percentile) £75,000 £48,500 £65,000
Median % change year-on-year +54.64% -25.38% +4.00%
75th Percentile £105,000 £63,750 £88,750
90th Percentile £137,500 £97,500 £99,750
UK median annual salary £72,500 £50,000 £64,029
% change year-on-year +45.00% -21.91% +2.45%

All Process and Methodology Skills
England

Creative Thinking falls under the Processes and Methodologies category. For comparison with the information above, the following table provides summary statistics for all permanent job vacancies requiring process or methodology skills in England.

Permanent vacancies with a requirement for process or methodology skills 46,039 75,199 82,570
As % of all permanent jobs advertised in England 94.03% 84.05% 95.58%
Number of salaries quoted 22,875 54,702 49,146
10th Percentile £29,500 £29,000 £34,452
25th Percentile £41,250 £40,000 £46,000
Median annual salary (50th Percentile) £57,500 £55,000 £62,500
Median % change year-on-year +4.55% -12.00% +4.17%
75th Percentile £75,000 £72,500 £82,500
90th Percentile £97,528 £93,750 £102,500
UK median annual salary £57,443 £55,000 £60,899
% change year-on-year +4.44% -9.69% +1.50%

Creative Thinking
Job Vacancy Trend in England

Job postings citing Creative Thinking as a proportion of all IT jobs advertised in England.
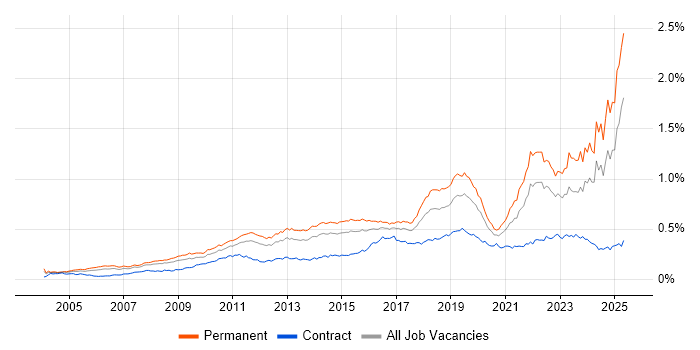
Job vacancy trend for Creative Thinking in England

Creative Thinking
Salary Trend in England

3-month moving average salary quoted in jobs citing Creative Thinking in England.

Salary trend for Creative Thinking in England

Creative Thinking
Salary Histogram in England

Salary distribution for jobs citing Creative Thinking in England over the 6 months to 30 May 2025.

Salary histogram for Creative Thinking in England

Creative Thinking
Job Locations in England

The table below looks at the demand and provides a guide to the median salaries quoted in IT jobs citing Creative Thinking within the England region over the 6 months to 30 May 2025. The 'Rank Change' column provides an indication of the change in demand within each location based on the same 6 month period last year.

Location Rank Change
on Same Period
Last Year
Matching
Permanent
IT Job Ads
Median Salary
Past 6 Months
Median Salary
% Change
on Same Period
Last Year
Live
Jobs
London +108 319 £85,000 +60.38% 179
North of England +164 249 £55,445 +65.35% 264
North West +142 226 £50,890 +33.92% 111
South East +156 216 £32,500 -27.78% 384
Midlands -45 69 - - 229
East of England +53 53 £55,000 +37.50% 181
West Midlands -50 52 - - 121
South West +25 25 £66,367 +56.16% 146
Yorkshire +43 20 £82,319 +37.20% 123
East Midlands +11 17 - - 93
North East +42 3 - - 31
Creative Thinking
UK

Creative Thinking
Co-occurring Skills and Capabilities in England by Category

The follow tables expand on the table above by listing co-occurrences grouped by category. The same employment type, locality and period is covered with up to 20 co-occurrences shown in each of the following categories:

Application Platforms
1 25 (2.53%) CMS
2 15 (1.52%) SharePoint
3 5 (0.51%) WordPress
4 4 (0.40%) Confluence
5 2 (0.20%) Adobe Experience Manager
5 2 (0.20%) Apache Spark
5 2 (0.20%) SAS
6 1 (0.10%) CICS
6 1 (0.10%) Drupal
6 1 (0.10%) Umbraco
Applications
1 19 (1.92%) Microsoft Office
2 15 (1.52%) Microsoft Excel
3 7 (0.71%) Trello
4 6 (0.61%) Microsoft PowerPoint
5 5 (0.51%) Adobe Creative Suite
5 5 (0.51%) Adobe Illustrator
5 5 (0.51%) Photoshop
6 3 (0.30%) Adobe After Effects
6 3 (0.30%) Adobe XD
6 3 (0.30%) InDesign
6 3 (0.30%) Microsoft Project
6 3 (0.30%) UserZoom
7 1 (0.10%) Adobe Premiere
7 1 (0.10%) Stata
Business Applications
1 20 (2.02%) Dynamics AX
2 12 (1.21%) Dynamics CRM
3 5 (0.51%) PeopleSoft Financials
3 5 (0.51%) Relativity
4 4 (0.40%) Ringtail
4 4 (0.40%) Veritas eDiscovery
5 1 (0.10%) Oracle EBS
5 1 (0.10%) Salesforce CRM
Cloud Services
1 305 (30.84%) Azure
2 257 (25.99%) AWS
3 220 (22.24%) GCP
3 220 (22.24%) Serverless
4 215 (21.74%) AWS Lambda
5 42 (4.25%) PaaS
6 36 (3.64%) SaaS
7 27 (2.73%) Azure DevOps
8 24 (2.43%) Power Platform
9 22 (2.22%) Microsoft 365
10 21 (2.12%) Amazon EC2
11 18 (1.82%) Figma
12 17 (1.72%) iPaaS
13 15 (1.52%) Google Analytics
14 10 (1.01%) Dynamics 365
15 8 (0.81%) Cloud Computing
16 7 (0.71%) IBM Watson
17 6 (0.61%) Azure Logic Apps
17 6 (0.61%) ChatGPT
17 6 (0.61%) Entra ID
Communications & Networking
1 215 (21.74%) Broadband
2 8 (0.81%) 5G
2 8 (0.81%) Firewall
2 8 (0.81%) SD-WAN
2 8 (0.81%) WAN
3 7 (0.71%) Intranet
4 6 (0.61%) VPN
5 5 (0.51%) Software-Defined Radio
5 5 (0.51%) Wireless
6 4 (0.40%) Network Security
7 2 (0.20%) Bluetooth
7 2 (0.20%) DNS
7 2 (0.20%) Ethernet
7 2 (0.20%) FlexRay
7 2 (0.20%) TCP/IP
7 2 (0.20%) Wi-Fi
Database & Business Intelligence
1 27 (2.73%) PostgreSQL
2 17 (1.72%) SQL Server
3 16 (1.62%) Power BI
4 14 (1.42%) Relational Database
5 10 (1.01%) Data Lake
6 8 (0.81%) MySQL
7 7 (0.71%) QlikView
8 4 (0.40%) EDRMS
8 4 (0.40%) MongoDB
8 4 (0.40%) RDBMS
9 2 (0.20%) Big Data
9 2 (0.20%) KDB
9 2 (0.20%) Kdb+
10 1 (0.10%) Data Vault
10 1 (0.10%) DB2
10 1 (0.10%) Metadata
10 1 (0.10%) NoSQL
10 1 (0.10%) SQL Server Reporting Services
Development Applications
1 21 (2.12%) IntelliJ
2 12 (1.21%) JIRA
3 3 (0.30%) Axure RP
3 3 (0.30%) Balsamiq
3 3 (0.30%) Git
4 2 (0.20%) Jenkins
4 2 (0.20%) Visual Studio
5 1 (0.10%) Burp Suite
5 1 (0.10%) GitLab
5 1 (0.10%) IBM UrbanCode
5 1 (0.10%) Metasploit
5 1 (0.10%) Moq
5 1 (0.10%) Postman
5 1 (0.10%) SoapUI
5 1 (0.10%) SpecFlow
General
1 345 (34.88%) Analytical Skills
2 339 (34.28%) Legal
3 312 (31.55%) Inclusion and Diversity
4 296 (29.93%) Law
5 269 (27.20%) Social Skills
6 266 (26.90%) Finance
7 157 (15.87%) Marketing
8 63 (6.37%) Retail
9 52 (5.26%) Telecoms
10 45 (4.55%) Organisational Skills
11 43 (4.35%) Advertising
12 41 (4.15%) Banking
13 37 (3.74%) Presentation Skills
14 24 (2.43%) Games
14 24 (2.43%) Manufacturing
15 17 (1.72%) Electronics
16 15 (1.52%) Influencing Skills
17 9 (0.91%) Multimedia
18 8 (0.81%) Public Sector
19 7 (0.71%) Public Speaking
Job Titles
1 357 (36.10%) Senior
2 215 (21.74%) Machine Learning Engineer
3 51 (5.16%) Risk Manager
4 47 (4.75%) Lead
5 42 (4.25%) Analyst
6 38 (3.84%) Account Manager
7 34 (3.44%) Strategic Account Manager
8 33 (3.34%) Technology Risk Manager
9 32 (3.24%) Architect
10 28 (2.83%) Senior Manager
11 26 (2.63%) Audit Manager
12 21 (2.12%) Designer
12 21 (2.12%) Java Engineer
13 19 (1.92%) Senior Audit Manager
14 17 (1.72%) Applications Architect
14 17 (1.72%) IT Architect
15 16 (1.62%) Project Manager
16 15 (1.52%) Developer
16 15 (1.52%) Security Engineer
16 15 (1.52%) Software Engineer
Libraries, Frameworks & Software Standards
1 28 (2.83%) React
2 19 (1.92%) .NET
3 18 (1.82%) .NET Framework
4 17 (1.72%) HTML
4 17 (1.72%) REST
5 15 (1.52%) YAML
6 12 (1.21%) CSS
7 8 (0.81%) RESTful
8 3 (0.30%) AngularJS
8 3 (0.30%) Node.js
9 2 (0.20%) Django
9 2 (0.20%) Middleware
9 2 (0.20%) Spring
9 2 (0.20%) Spring MVC
10 1 (0.10%) ASP.NET
10 1 (0.10%) Hibernate
10 1 (0.10%) JDBC
10 1 (0.10%) JMS
10 1 (0.10%) SOAP
10 1 (0.10%) Visualforce
Miscellaneous
1 283 (28.61%) Cyberattack
2 236 (23.86%) Self-Motivation
3 63 (6.37%) Product Ownership
4 54 (5.46%) Robotics
5 53 (5.36%) Management Information System
6 50 (5.06%) Blockchain
7 35 (3.54%) Digital Media
8 34 (3.44%) Marketing Technology
9 26 (2.63%) Social Media
10 25 (2.53%) Greenfield Project
11 22 (2.22%) Security Posture
12 13 (1.31%) Cloud Native
13 12 (1.21%) Data Structures
14 10 (1.01%) Onboarding
15 9 (0.91%) Analytical Mindset
16 8 (0.81%) Self-Driving Car
17 7 (0.71%) Embedded Systems
18 6 (0.61%) Blog
19 5 (0.51%) Enterprise Software
19 5 (0.51%) FMCG
Operating Systems
1 17 (1.72%) Windows
2 10 (1.01%) Apple iOS
3 8 (0.81%) Linux
4 5 (0.51%) Windows 10
5 4 (0.40%) Android
5 4 (0.40%) Windows Server
6 1 (0.10%) zOS
Processes & Methodologies
1 522 (52.78%) Agile
2 489 (49.44%) Mentoring
3 366 (37.01%) Problem-Solving
4 318 (32.15%) Cybersecurity
5 295 (29.83%) Line Management
6 232 (23.46%) CI/CD
6 232 (23.46%) Data Science
7 230 (23.26%) Machine Learning
8 227 (22.95%) Coaching
9 218 (22.04%) Personalization
10 217 (21.94%) Performance Metrics
11 216 (21.84%) Clean Code
12 133 (13.45%) Analytics
13 125 (12.64%) Risk Management
14 96 (9.71%) Continuous Improvement
15 90 (9.10%) Strategic Thinking
16 82 (8.29%) Artificial Intelligence
16 82 (8.29%) Data Analytics
16 82 (8.29%) Project Management
17 55 (5.56%) Digital Marketing
Programming Languages
1 247 (24.97%) Python
2 215 (21.74%) TypeScript
3 28 (2.83%) Java
4 22 (2.22%) JavaScript
4 22 (2.22%) PowerShell
4 22 (2.22%) SQL
5 16 (1.62%) C#
6 14 (1.42%) R
7 6 (0.61%) C++
8 5 (0.51%) Bicep
9 3 (0.30%) MATLAB
10 2 (0.20%) C
10 2 (0.20%) Perl
10 2 (0.20%) PHP
10 2 (0.20%) Tcl
10 2 (0.20%) VB
11 1 (0.10%) ActionScript
11 1 (0.10%) ActionScript 2.0
11 1 (0.10%) Apex Code
11 1 (0.10%) VBA
Qualifications
1 298 (30.13%) Degree
2 232 (23.46%) PhD
3 41 (4.15%) CISA
4 37 (3.74%) Master's Degree
5 34 (3.44%) CISSP
6 21 (2.12%) CISM
7 20 (2.02%) ISACA
8 19 (1.92%) ACCA
8 19 (1.92%) CCAB
8 19 (1.92%) CIMA
8 19 (1.92%) CIPFA
8 19 (1.92%) Computer Science Degree
8 19 (1.92%) CRISC
8 19 (1.92%) ICAEW
9 9 (0.91%) Microsoft Certification
10 6 (0.61%) Azure Certification
10 6 (0.61%) PMI Certification
10 6 (0.61%) PMP
11 4 (0.40%) CEH
11 4 (0.40%) Security Cleared
Quality Assurance & Compliance
1 300 (30.33%) NCSC
2 54 (5.46%) ITGC
3 52 (5.26%) ISO/IEC 27001
4 22 (2.22%) SOC 2
5 19 (1.92%) NIST
6 15 (1.52%) Accessibility
6 15 (1.52%) Sarbanes-Oxley
7 11 (1.11%) GDPR
8 8 (0.81%) PMO
9 5 (0.51%) COBIT
9 5 (0.51%) QA
10 4 (0.40%) Data Quality
11 3 (0.30%) WCAG
12 2 (0.20%) California Consumer Privacy Act
12 2 (0.20%) Cyber Essentials
12 2 (0.20%) Cyber Essentials PLUS
12 2 (0.20%) JTAG
12 2 (0.20%) PCI DSS
System Software
1 24 (2.43%) Docker
2 11 (1.11%) Active Directory
3 6 (0.61%) Virtual Desktop
3 6 (0.61%) Virtual Machines
4 2 (0.20%) Embedded Firmware
4 2 (0.20%) Firmware
Systems Management
1 23 (2.33%) Kubernetes
2 6 (0.61%) Microsoft Intune
3 5 (0.51%) Ansible
3 5 (0.51%) CASB
3 5 (0.51%) Nagios
3 5 (0.51%) SCCM
4 4 (0.40%) Graylog
4 4 (0.40%) Opsgenie
5 1 (0.10%) CA Service Virtualization
5 1 (0.10%) Grafana
5 1 (0.10%) Nessus
5 1 (0.10%) Progress Chef
5 1 (0.10%) Prometheus
5 1 (0.10%) Puppet
5 1 (0.10%) RSA Archer
Vendors
1 90 (9.10%) Microsoft
2 23 (2.33%) Oracle
3 21 (2.12%) SAP
4 18 (1.82%) ServiceNow
5 16 (1.62%) Adobe
5 16 (1.62%) Google
6 12 (1.21%) Databricks
6 12 (1.21%) IBM
7 10 (1.01%) Workday
8 7 (0.71%) Xilinx
9 6 (0.61%) Apple
9 6 (0.61%) Citrix
10 5 (0.51%) Intapp
10 5 (0.51%) PeopleSoft
10 5 (0.51%) Sophos
11 4 (0.40%) Cisco
11 4 (0.40%) JD Edwards
11 4 (0.40%) Nuix
11 4 (0.40%) Palo Alto
11 4 (0.40%) Twitter