Innovative Thinking Jobs in England

Innovative Thinking
UK > England

The table below provides summary statistics for permanent job vacancies advertised in England requiring Innovative Thinking skills. It includes a benchmarking guide to the annual salaries offered in vacancies that cited Innovative Thinking over the 6 months leading up to 31 May 2025, comparing them to the same period in the previous two years.

6 months to
31 May 2025
Same period 2024 Same period 2023
Rank 361 367 452
Rank change year-on-year +6 +85 -142
Permanent jobs citing Innovative Thinking 359 621 551
As % of all permanent jobs advertised in England 0.73% 0.69% 0.65%
As % of the Processes & Methodologies category 0.77% 0.82% 0.68%
Number of salaries quoted 85 363 231
10th Percentile £29,900 £29,000 £31,250
25th Percentile £40,000 £42,000 £45,875
Median annual salary (50th Percentile) £61,000 £55,000 £65,000
Median % change year-on-year +10.91% -15.38% +18.18%
75th Percentile £115,000 £70,609 £95,000
90th Percentile - £81,250 £107,500
UK median annual salary £59,500 £55,000 £65,000
% change year-on-year +8.18% -15.38% +23.81%

All Process and Methodology Skills
England

Innovative Thinking falls under the Processes and Methodologies category. For comparison with the information above, the following table provides summary statistics for all permanent job vacancies requiring process or methodology skills in England.

Permanent vacancies with a requirement for process or methodology skills 46,342 75,409 81,364
As % of all permanent jobs advertised in England 93.97% 83.96% 95.53%
Number of salaries quoted 23,102 54,812 48,959
10th Percentile £29,250 £29,000 £34,452
25th Percentile £41,250 £40,000 £46,000
Median annual salary (50th Percentile) £57,500 £55,000 £62,500
Median % change year-on-year +4.55% -12.00% +4.17%
75th Percentile £75,000 £72,500 £82,500
90th Percentile £97,528 £93,750 £102,500
UK median annual salary £57,000 £55,000 £60,899
% change year-on-year +3.64% -9.69% +1.50%

Innovative Thinking
Job Vacancy Trend in England

Job postings citing Innovative Thinking as a proportion of all IT jobs advertised in England.
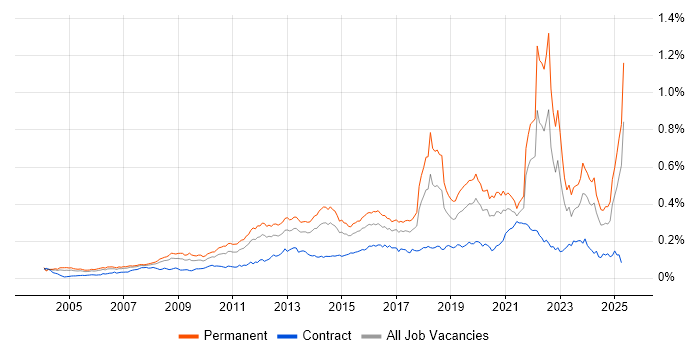
Job vacancy trend for Innovative Thinking in England

Innovative Thinking
Salary Trend in England

3-month moving average salary quoted in jobs citing Innovative Thinking in England.

Salary trend for Innovative Thinking in England

Innovative Thinking
Salary Histogram in England

Salary distribution for jobs citing Innovative Thinking in England over the 6 months to 31 May 2025.

Salary histogram for Innovative Thinking in England

Innovative Thinking
Job Locations in England

The table below looks at the demand and provides a guide to the median salaries quoted in IT jobs citing Innovative Thinking within the England region over the 6 months to 31 May 2025. The 'Rank Change' column provides an indication of the change in demand within each location based on the same 6 month period last year.

Location Rank Change
on Same Period
Last Year
Matching
Permanent
IT Job Ads
Median Salary
Past 6 Months
Median Salary
% Change
on Same Period
Last Year
Live
Jobs
South East +103 130 £43,750 +9.38% 34
London +44 110 £110,000 +60.00% 180
North of England -36 49 £75,000 +50.00% 26
North West -16 47 - - 21
South West +48 46 £54,282 -9.53% 34
East of England +36 16 £55,000 +89.66% 9
Midlands +2 8 £40,500 -19.00% 35
West Midlands +17 5 £37,500 -31.82% 23
East Midlands +19 3 £62,500 +25.00% 12
Yorkshire +19 2 £75,000 +61.44% 5
Innovative Thinking
UK

Innovative Thinking
Co-occurring Skills and Capabilities in England by Category

The follow tables expand on the table above by listing co-occurrences grouped by category. The same employment type, locality and period is covered with up to 20 co-occurrences shown in each of the following categories:

Application Platforms
1 22 (6.13%) IBM Domino
2 11 (3.06%) Microsoft Exchange
3 4 (1.11%) Apache Spark
4 3 (0.84%) nginx
4 3 (0.84%) Tomcat
5 2 (0.56%) Adobe Experience Manager
5 2 (0.56%) CMS
5 2 (0.56%) Confluence
5 2 (0.56%) SharePoint
Applications
1 4 (1.11%) Simulink
2 3 (0.84%) Adobe Creative Suite
2 3 (0.84%) Adobe Illustrator
2 3 (0.84%) InDesign
2 3 (0.84%) Photoshop
3 2 (0.56%) Adobe After Effects
3 2 (0.56%) Microsoft Excel
Business Applications
1 15 (4.18%) Sparx Enterprise Architect
2 7 (1.95%) Q-Pulse
3 1 (0.28%) Oracle EBS
Cloud Services
1 68 (18.94%) Azure
2 47 (13.09%) AWS
3 23 (6.41%) GCP
4 12 (3.34%) Microsoft 365
5 8 (2.23%) Figma
6 7 (1.95%) Amazon EC2
7 6 (1.67%) IaaS
8 4 (1.11%) AWS Lambda
8 4 (1.11%) Google Docs
8 4 (1.11%) Google Sheets
8 4 (1.11%) Miro
8 4 (1.11%) SaaS
8 4 (1.11%) Serverless
8 4 (1.11%) Slack
9 3 (0.84%) Amazon ElastiCache
9 3 (0.84%) Amazon OpenSearch
9 3 (0.84%) Amazon SQS
9 3 (0.84%) BrowserStack
9 3 (0.84%) Sauce Labs
10 2 (0.56%) Adobe Analytics
Communications & Networking
1 39 (10.86%) Software-Defined Radio
2 18 (5.01%) ATM
2 18 (5.01%) VoIP
2 18 (5.01%) Wireless
3 9 (2.51%) WAN
4 8 (2.23%) 5G
4 8 (2.23%) SD-WAN
5 6 (1.67%) SAN
6 5 (1.39%) Firewall
7 3 (0.84%) DHCP
7 3 (0.84%) DNS
7 3 (0.84%) Network Security
7 3 (0.84%) VPN
8 2 (0.56%) Intrusion Detection
8 2 (0.56%) Multicast
8 2 (0.56%) TCP/IP
9 1 (0.28%) IOS XR
9 1 (0.28%) LTE
9 1 (0.28%) Modbus
9 1 (0.28%) Unicast
Database & Business Intelligence
1 54 (15.04%) Data Lake
2 21 (5.85%) Metadata
3 11 (3.06%) PostgreSQL
4 5 (1.39%) Elasticsearch
5 4 (1.11%) Amazon Redshift
5 4 (1.11%) Apache Hive
5 4 (1.11%) Hadoop
5 4 (1.11%) MySQL
6 3 (0.84%) Amazon Aurora
6 3 (0.84%) Amazon RDS
7 2 (0.56%) Power BI
7 2 (0.56%) Redis
8 1 (0.28%) Data Warehouse
8 1 (0.28%) DynamoDB
8 1 (0.28%) NoSQL
8 1 (0.28%) SQL Server Integration Services
8 1 (0.28%) SQL Server Reporting Services
8 1 (0.28%) TimescaleDB
Development Applications
1 7 (1.95%) IntelliJ
1 7 (1.95%) JIRA
2 5 (1.39%) Cucumber
2 5 (1.39%) Maven
3 4 (1.11%) Jenkins
4 3 (0.84%) Appium
4 3 (0.84%) Bitbucket
4 3 (0.84%) JUnit
4 3 (0.84%) Mockito
4 3 (0.84%) Postman
4 3 (0.84%) Selenium
4 3 (0.84%) SonarQube
4 3 (0.84%) TestNG
5 2 (0.56%) Git
General
1 121 (33.70%) Analytical Skills
1 121 (33.70%) Finance
2 92 (25.63%) Social Skills
3 47 (13.09%) Influencing Skills
4 39 (10.86%) Law
5 33 (9.19%) Inclusion and Diversity
6 31 (8.64%) Banking
7 28 (7.80%) Military
8 27 (7.52%) Retail Banking
9 26 (7.24%) Manufacturing
10 25 (6.96%) Financial Institution
11 20 (5.57%) Public Sector
12 17 (4.74%) Marketing
13 12 (3.34%) Electronics
14 11 (3.06%) Organisational Skills
15 10 (2.79%) Presentation Skills
16 9 (2.51%) Aerospace
17 7 (1.95%) Aviation
18 5 (1.39%) Legal
19 4 (1.11%) Telecoms
Job Titles
1 54 (15.04%) Senior
2 49 (13.65%) Systems Engineer
3 32 (8.91%) Lead
4 28 (7.80%) Software Engineer
5 24 (6.69%) Architect
6 22 (6.13%) Project Manager
6 22 (6.13%) Quality Manager
7 21 (5.85%) Data Architect
7 21 (5.85%) QA Manager
8 20 (5.57%) Delivery Project Manager
9 19 (5.29%) Associate Director
9 19 (5.29%) Radio Engineer
10 18 (5.01%) Field Engineer
10 18 (5.01%) Field Service Engineer
11 17 (4.74%) Embedded Engineer
11 17 (4.74%) Embedded Software Engineer
12 15 (4.18%) Administrator
12 15 (4.18%) Systems Administrator
13 12 (3.34%) Java Engineer
13 12 (3.34%) Supplier Manager
Libraries, Frameworks & Software Standards
1 14 (3.90%) React
2 11 (3.06%) RESTful
3 9 (2.51%) Flutter
3 9 (2.51%) React Native
4 7 (1.95%) REST
4 7 (1.95%) XML
5 5 (1.39%) SAML
6 4 (1.11%) .NET
6 4 (1.11%) Keras
6 4 (1.11%) Laravel
6 4 (1.11%) Node.js
6 4 (1.11%) NumPy
6 4 (1.11%) SciPy
6 4 (1.11%) SpaCy
6 4 (1.11%) TensorFlow
7 3 (0.84%) Elastic Stack
7 3 (0.84%) OpenAPI
7 3 (0.84%) Playwright
7 3 (0.84%) Swagger
7 3 (0.84%) WireMock
Miscellaneous
1 73 (20.33%) e-Learning
2 36 (10.03%) Analytical Mindset
3 24 (6.69%) FPGA
4 19 (5.29%) Driving Licence
4 19 (5.29%) MicroBlaze
5 17 (4.74%) Embedded Systems
5 17 (4.74%) RISC-V
6 11 (3.06%) Product Ownership
7 10 (2.79%) Self-Motivation
8 8 (2.23%) Cloud Native
8 8 (2.23%) Self-Driving Car
9 7 (1.95%) Reference Data
10 5 (1.39%) PKI
11 3 (0.84%) Life Science
12 2 (0.56%) Algorithms
12 2 (0.56%) Animation
12 2 (0.56%) IoT
12 2 (0.56%) Management Information System
12 2 (0.56%) VHDL
12 2 (0.56%) Video Editing
Operating Systems
1 43 (11.98%) Linux
2 19 (5.29%) Windows
3 17 (4.74%) Embedded Linux
4 10 (2.79%) Windows Server
5 1 (0.28%) Apple iOS
5 1 (0.28%) Unix
5 1 (0.28%) Windows 10
5 1 (0.28%) Windows Server 2012
5 1 (0.28%) Windows Server 2016
5 1 (0.28%) Windows Server 2019
Processes & Methodologies
1 121 (33.70%) Agile
2 108 (30.08%) Problem-Solving
3 64 (17.83%) Analytics
4 55 (15.32%) Project Management
5 51 (14.21%) Roadmaps
6 49 (13.65%) Project Delivery
6 49 (13.65%) Stakeholder Management
7 42 (11.70%) Machine Learning
8 41 (11.42%) Business Development
8 41 (11.42%) Signal Processing
9 40 (11.14%) Data Science
10 39 (10.86%) Data Strategy
10 39 (10.86%) Digital Signal Processing
10 39 (10.86%) Strategic Roadmap
11 37 (10.31%) Software Engineering
12 36 (10.03%) Artificial Intelligence
13 35 (9.75%) Actionable Insight
13 35 (9.75%) Thought Leadership
14 34 (9.47%) Co-Creation
15 33 (9.19%) People Analytics
Programming Languages
1 25 (6.96%) MATLAB
2 21 (5.85%) C++
3 20 (5.57%) C
4 18 (5.01%) Python
4 18 (5.01%) SQL
5 17 (4.74%) Java
6 11 (3.06%) JavaScript
7 7 (1.95%) Perl
7 7 (1.95%) PHP
7 7 (1.95%) PL/SQL
8 4 (1.11%) TypeScript
9 3 (0.84%) Tcl
10 2 (0.56%) Bash
10 2 (0.56%) C#
10 2 (0.56%) VB
11 1 (0.28%) Data Analysis Expressions
11 1 (0.28%) PowerShell
11 1 (0.28%) Ruby
11 1 (0.28%) Shell Script
11 1 (0.28%) Swift
Qualifications
1 114 (31.75%) Security Cleared
2 96 (26.74%) SC Cleared
3 62 (17.27%) Degree
4 28 (7.80%) BPSS Clearance
5 26 (7.24%) Azure Certification
6 23 (6.41%) Cisco Certification
6 23 (6.41%) DV Cleared
7 22 (6.13%) CCNP
8 21 (5.85%) AWS Certification
9 15 (4.18%) RHCSA
10 9 (2.51%) DBS Check
11 8 (2.23%) Master's Degree
12 7 (1.95%) PhD
13 5 (1.39%) CCNA
13 5 (1.39%) Computer Science Degree
13 5 (1.39%) VMware Certified Professional (VCP)
14 3 (0.84%) CCIE
15 2 (0.56%) JNCIE
15 2 (0.56%) JNCIP
16 1 (0.28%) Six Sigma Black Belt
Quality Assurance & Compliance
1 25 (6.96%) QA
2 10 (2.79%) PMO
3 7 (1.95%) Data Quality
4 5 (1.39%) GDPR
4 5 (1.39%) SLA
5 3 (0.84%) ISO/IEC 27001
6 2 (0.56%) Cyber Essentials
6 2 (0.56%) HIPAA
6 2 (0.56%) NIST
6 2 (0.56%) NIST 800
7 1 (0.28%) Accessibility
7 1 (0.28%) Actionable Recommendations
7 1 (0.28%) AQAP
7 1 (0.28%) Government Security Classifications
7 1 (0.28%) ISO 9001
7 1 (0.28%) Software Quality Assurance
System Software
1 41 (11.42%) Firmware
2 38 (10.58%) Embedded Firmware
3 11 (3.06%) Docker
4 7 (1.95%) Active Directory
5 6 (1.67%) Hyper-V
5 6 (1.67%) VMware ESXi
6 2 (0.56%) VMware Infrastructure
7 1 (0.28%) Virtual Desktop
7 1 (0.28%) VMware NSX
Systems Management
1 14 (3.90%) Kubernetes
2 6 (1.67%) Ansible
3 5 (1.39%) Single Sign-On
4 3 (0.84%) Kustomize
4 3 (0.84%) Packer
4 3 (0.84%) Terraform
5 2 (0.56%) Grafana
5 2 (0.56%) Prometheus
6 1 (0.28%) Avamar
6 1 (0.28%) Progress Chef
6 1 (0.28%) Puppet
6 1 (0.28%) vCenter Server
6 1 (0.28%) VxRail
Vendors
1 30 (8.36%) Microsoft
2 18 (5.01%) Red Hat
3 17 (4.74%) Cisco
4 15 (4.18%) Sparx
5 7 (1.95%) Google
5 7 (1.95%) VMware
6 5 (1.39%) Adobe
6 5 (1.39%) Veeam
6 5 (1.39%) Xilinx
7 2 (0.56%) Altera
7 2 (0.56%) Green Hills
8 1 (0.28%) Apple
8 1 (0.28%) Bloomberg
8 1 (0.28%) Dell
8 1 (0.28%) EMC
8 1 (0.28%) NetApp
8 1 (0.28%) Oracle
8 1 (0.28%) Progress
8 1 (0.28%) Salesforce
8 1 (0.28%) SAP