.NET Job Trends in the UK excluding London

Microsoft .NET (dotNet)
UK > UK excluding London

The table below provides summary statistics and salary benchmarking for jobs advertised in the UK excluding London requiring .NET skills. It covers permanent job vacancies from the 6 months leading up to 2 November 2025, with comparisons to the same periods in the previous two years.

6 months to
2 Nov 2025
Same period 2024 Same period 2023
Rank 73 25 24
Rank change year-on-year -48 -1 -5
Permanent jobs citing .NET 1,166 3,157 2,624
As % of all permanent jobs in the UK excluding London 3.34% 6.58% 8.46%
As % of the Libraries, Frameworks & Software Standards category 27.08% 36.50% 33.48%
Number of salaries quoted 861 2,136 2,375
10th Percentile £35,000 £36,250 £37,250
25th Percentile £43,750 £45,000 £45,000
Median annual salary (50th Percentile) £57,500 £55,000 £55,000
Median % change year-on-year +4.55% - -
75th Percentile £72,500 £69,500 £68,750
90th Percentile £83,750 £80,000 £80,000
UK median annual salary £62,500 £60,000 £65,000
% change year-on-year +4.17% -7.69% +8.33%

All Software Libraries and Frameworks
UK excluding London

.NET falls under the Software Libraries and Frameworks category. For comparison with the information above, the following table provides summary statistics for all permanent job vacancies requiring technical specification, industry standards, software libraries and framework skills in the UK excluding London.

Permanent vacancies with a requirement for technical specification, industry standards, software libraries and framework skills 4,305 8,650 7,837
As % of all permanent jobs advertised in the UK excluding London 12.33% 18.03% 25.26%
Number of salaries quoted 2,666 4,935 6,156
10th Percentile £30,500 £35,000 £36,270
25th Percentile £42,500 £45,000 £45,000
Median annual salary (50th Percentile) £57,500 £57,000 £57,500
Median % change year-on-year +0.88% -0.87% +0.88%
75th Percentile £72,500 £70,000 £72,500
90th Percentile £83,500 £82,500 £84,056
UK median annual salary £67,500 £65,000 £65,351
% change year-on-year +3.85% -0.54% +0.54%

.NET
Job Vacancy Trend in the UK excluding London

Historical trend showing the proportion of permanent IT job postings citing .NET relative to all permanent IT jobs advertised in the UK excluding London.
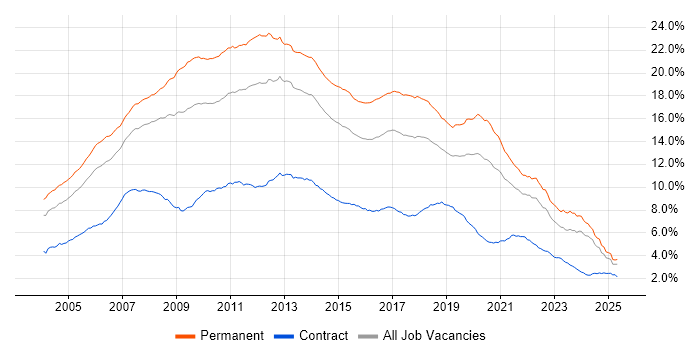
.NET job vacancy trend in the UK excluding London

.NET
Salary Trend in the UK excluding London

Salary distribution trend for jobs in the UK excluding London citing .NET.

Salary distribution trend for jobs in the UK excluding London citing .NET

.NET
Salary Histogram in the UK excluding London

Salary distribution for jobs citing .NET in the UK excluding London over the 6 months to 2 November 2025.

Salary histogram for .NET in the UK excluding London

.NET
Job Locations in the UK excluding London

The table below looks at the demand and provides a guide to the median salaries quoted in IT jobs citing .NET within the UK excluding London region over the 6 months to 2 November 2025. The 'Rank Change' column provides an indication of the change in demand within each location based on the same 6 month period last year.

Location Rank Change
on Same Period
Last Year
Matching
Permanent
IT Job Ads
Median Salary
Past 6 Months
Median Salary
% Change
on Same Period
Last Year
Live
Jobs
North of England -23 476 £60,000 +9.09% 165
North West -9 325 £65,000 +18.18% 106
South East -56 280 £57,500 -4.17% 246
Midlands -65 164 £55,000 - 89
West Midlands -34 112 £55,000 - 52
Yorkshire -46 104 £60,000 +14.29% 29
East of England -41 98 £57,500 +15.00% 49
South West -62 78 £52,500 -4.55% 53
East Midlands -63 52 £55,000 +10.00% 37
North East -21 47 £47,500 -20.83% 32
Scotland -94 33 £64,500 +17.27% 23
Wales -14 32 £55,000 -8.33% 31
Northern Ireland -13 4 £62,500 -3.85% 8
Isle of Man - 1 £52,500 -
.NET
UK

.NET
Co-Occurring Skills & Capabilities in the UK excluding London by Category

The following tables expand on the one above by listing co-occurrences grouped by category. They cover the same employment type, locality and period, with up to 20 co-occurrences shown in each category:

Application Platforms
1 60 (5.15%) IIS
2 24 (2.06%) CMS
3 17 (1.46%) SharePoint
4 11 (0.94%) Microsoft Exchange
4 11 (0.94%) Umbraco
5 9 (0.77%) Confluence
6 5 (0.43%) BizTalk Server
6 5 (0.43%) nginx
7 3 (0.26%) ArcGIS
7 3 (0.26%) Tomcat
8 2 (0.17%) HCL Notes
8 2 (0.17%) NServiceBus
8 2 (0.17%) Oracle SOA Suite
9 1 (0.086%) Apache Airflow
9 1 (0.086%) Apache Solr
9 1 (0.086%) ColdFusion
9 1 (0.086%) Jupyter
9 1 (0.086%) Kentico
9 1 (0.086%) WebSphere
9 1 (0.086%) WebSphere Application Server
Applications
1 6 (0.51%) Microsoft Excel
2 3 (0.26%) S-PLUS
3 2 (0.17%) Microsoft Office
4 1 (0.086%) Adobe Illustrator
4 1 (0.086%) Adobe XD
4 1 (0.086%) MS Visio
Business Applications
1 57 (4.89%) Dynamics CRM
2 8 (0.69%) Infor CloudSuite Industrial (formerly SyteLine)
3 6 (0.51%) Infor CloudSuite
4 4 (0.34%) Sage 1000
5 2 (0.17%) Oracle BPM
6 1 (0.086%) Advent Geneva
6 1 (0.086%) Loan IQ
6 1 (0.086%) Magento
6 1 (0.086%) Raiser’s Edge
6 1 (0.086%) SAP Business One
6 1 (0.086%) Shopify
Cloud Services
1 771 (66.12%) Azure
2 409 (35.08%) AWS
3 220 (18.87%) GCP
4 201 (17.24%) Azure DevOps
5 136 (11.66%) SaaS
6 85 (7.29%) Power Platform
7 82 (7.03%) GitHub
8 77 (6.60%) Serverless
9 66 (5.66%) Dynamics 365
10 63 (5.40%) Power Automate
11 43 (3.69%) Azure Logic Apps
11 43 (3.69%) Azure Service Bus
12 42 (3.60%) PowerApps
13 38 (3.26%) Azure Cosmos DB
13 38 (3.26%) GitHub Actions
14 34 (2.92%) Microsoft 365
15 29 (2.49%) Azure Functions
16 28 (2.40%) Entra ID
17 25 (2.14%) AWS Lambda
18 21 (1.80%) Azure AKS
Communications & Networking
1 11 (0.94%) Internet
2 10 (0.86%) TCP/IP
2 10 (0.86%) VoIP
3 7 (0.60%) DHCP
3 7 (0.60%) DNS
3 7 (0.60%) Ethernet
3 7 (0.60%) MQTT
3 7 (0.60%) VPN
3 7 (0.60%) WPA
4 6 (0.51%) Modbus
5 5 (0.43%) LAN
5 5 (0.43%) SAN
5 5 (0.43%) SSL
5 5 (0.43%) WAN
6 3 (0.26%) Firewall
7 2 (0.17%) Broadband
7 2 (0.17%) HTTP
8 1 (0.086%) Network Security
8 1 (0.086%) RS-232
8 1 (0.086%) RS-485
Database & Business Intelligence
1 317 (27.19%) SQL Server
2 60 (5.15%) MySQL
3 50 (4.29%) SQL Server Integration Services
4 44 (3.77%) NoSQL
5 42 (3.60%) SQL Server Reporting Services
6 37 (3.17%) MongoDB
6 37 (3.17%) Relational Database
7 34 (2.92%) Power BI
8 28 (2.40%) Elasticsearch
9 22 (1.89%) PostgreSQL
10 16 (1.37%) Redis
11 15 (1.29%) Azure SQL Database
11 15 (1.29%) RDBMS
12 11 (0.94%) DynamoDB
13 9 (0.77%) Crystal Reports
14 8 (0.69%) Oracle Database
15 6 (0.51%) Oracle Reports
16 5 (0.43%) Data Warehouse
16 5 (0.43%) Tableau
17 4 (0.34%) SQL CLR
Development Applications
1 124 (10.63%) Git
2 49 (4.20%) JIRA
3 37 (3.17%) Octopus Deploy
4 36 (3.09%) TeamCity
5 31 (2.66%) Visual Studio
6 25 (2.14%) Team Foundation Server
7 24 (2.06%) Postman
8 23 (1.97%) Selenium
9 22 (1.89%) Jenkins
10 16 (1.37%) SoapUI
10 16 (1.37%) WebDriver
11 15 (1.29%) NUnit
12 13 (1.11%) Storybook
13 9 (0.77%) GitLab
13 9 (0.77%) MSBuild
14 8 (0.69%) Bitbucket
15 6 (0.51%) git-flow
15 6 (0.51%) Jasmine
15 6 (0.51%) SpecFlow
15 6 (0.51%) SQL Server Management Studio (SSMS)
General
1 261 (22.38%) Social Skills
2 182 (15.61%) Inclusion and Diversity
3 163 (13.98%) Finance
4 52 (4.46%) Law
5 47 (4.03%) Retail
6 27 (2.32%) Manufacturing
7 26 (2.23%) Analytical Skills
8 23 (1.97%) Public Sector
9 22 (1.89%) Legal
10 18 (1.54%) Organisational Skills
11 16 (1.37%) Automotive
11 16 (1.37%) Games
12 12 (1.03%) Pharmaceutical
13 11 (0.94%) Banking
14 10 (0.86%) Back Office
14 10 (0.86%) Marketing
15 9 (0.77%) Electronics
16 7 (0.60%) Aviation
16 7 (0.60%) Documentation Skills
16 7 (0.60%) Publishing
Job Titles
1 577 (49.49%) Developer
2 364 (31.22%) Senior
3 283 (24.27%) Software Engineer
4 198 (16.98%) Senior Software Engineer
5 196 (16.81%) .NET Developer
6 133 (11.41%) Lead
7 131 (11.23%) Software Developer
8 122 (10.46%) Senior Developer
9 119 (10.21%) C# Developer
10 110 (9.43%) Full-Stack Developer
11 49 (4.20%) Lead Developer
12 47 (4.03%) C# .NET Developer
13 42 (3.60%) DevOps Engineer
14 40 (3.43%) Analyst
14 40 (3.43%) Senior .NET Developer
15 39 (3.34%) .NET Software Developer
16 38 (3.26%) Support Engineer
17 35 (3.00%) Full-Stack .NET Developer
18 34 (2.92%) Architect
18 34 (2.92%) Dynamics 365 Developer
Libraries, Frameworks & Software Standards
1 206 (17.67%) Node.js
2 204 (17.50%) React
3 191 (16.38%) ASP.NET
4 168 (14.41%) .NET Core
5 167 (14.32%) .NET Framework
6 165 (14.15%) CSS
7 151 (12.95%) HTML
8 133 (11.41%) AngularJS
9 97 (8.32%) RESTful
10 83 (7.12%) REST
11 79 (6.78%) Blazor
12 72 (6.17%) Entity Framework
13 66 (5.66%) Vue
14 43 (3.69%) ASP.NET Core
14 43 (3.69%) Web Services
15 36 (3.09%) jQuery
16 34 (2.92%) HTML5
17 30 (2.57%) ASP.NET MVC
17 30 (2.57%) ASP.NET Web API
18 29 (2.49%) WinForms
Miscellaneous
1 185 (15.87%) Self-Motivation
2 170 (14.58%) Cyberattack
2 170 (14.58%) Linux Command Line
3 80 (6.86%) Product Ownership
4 72 (6.17%) Cloud Native
5 46 (3.95%) Distributed Systems
5 46 (3.95%) Legacy Systems
6 38 (3.26%) Mobile App
7 29 (2.49%) Onboarding
8 28 (2.40%) Greenfield Project
9 26 (2.23%) Hybrid Cloud
10 25 (2.14%) Virtual Team
11 22 (1.89%) Enterprise Software
12 18 (1.54%) Renewable Energy
13 15 (1.29%) Clustering
13 15 (1.29%) IoT
14 11 (0.94%) Client/Server
15 7 (0.60%) Data Centre
15 7 (0.60%) Online Games
15 7 (0.60%) Public Cloud
Operating Systems
1 196 (16.81%) Linux
2 77 (6.60%) Windows
3 26 (2.23%) Windows Server
4 21 (1.80%) Android
5 20 (1.72%) Apple iOS
6 6 (0.51%) Mac OS
7 5 (0.43%) Windows 10
8 4 (0.34%) Red Hat Enterprise Linux
8 4 (0.34%) Ubuntu
9 3 (0.26%) Embedded Linux
9 3 (0.26%) VMS
10 2 (0.17%) Unix
11 1 (0.086%) Fedora
Processes & Methodologies
1 586 (50.26%) Agile
2 441 (37.82%) Software Engineering
3 347 (29.76%) DevOps
4 341 (29.25%) Microservices
5 338 (28.99%) Mentoring
6 330 (28.30%) CI/CD
7 269 (23.07%) Scrum
8 267 (22.90%) User Experience
9 228 (19.55%) Problem-Solving
10 219 (18.78%) Full-Stack Development
11 192 (16.47%) Machine Learning
12 184 (15.78%) Site Reliability Engineering
13 182 (15.61%) Cloud Security
14 179 (15.35%) Data Engineering
15 176 (15.09%) Continuous Improvement
16 120 (10.29%) MVC
17 103 (8.83%) Clean Code
18 93 (7.98%) SDLC
19 92 (7.89%) CRM
20 89 (7.63%) Roadmaps
Programming Languages
1 764 (65.52%) C#
2 468 (40.14%) JavaScript
3 394 (33.79%) SQL
4 276 (23.67%) Java
5 269 (23.07%) Python
6 208 (17.84%) C++
7 179 (15.35%) Go
8 173 (14.84%) Rust
9 141 (12.09%) TypeScript
10 50 (4.29%) PowerShell
11 48 (4.12%) VB.NET
12 44 (3.77%) PHP
13 40 (3.43%) T-SQL
14 17 (1.46%) Bicep
15 10 (0.86%) Bash
16 9 (0.77%) XAML
17 7 (0.60%) VB
18 6 (0.51%) C
18 6 (0.51%) PL/SQL
19 4 (0.34%) VBA
Qualifications
1 187 (16.04%) Security Cleared
2 174 (14.92%) AWS Certification
3 172 (14.75%) AWS Certified Developer
4 171 (14.67%) DV Cleared
5 170 (14.58%) AWS Certified Solutions Architect
6 141 (12.09%) Degree
7 70 (6.00%) Computer Science Degree
8 20 (1.72%) ISTQB
9 16 (1.37%) ISTQB Advanced Certification
10 13 (1.11%) Azure Certification
11 11 (0.94%) BPSS Clearance
11 11 (0.94%) SC Cleared
12 10 (0.86%) HND
13 8 (0.69%) Microsoft Certification
14 6 (0.51%) Chartered Engineer
14 6 (0.51%) HNC
14 6 (0.51%) Master's Degree
15 4 (0.34%) ISEB
15 4 (0.34%) ISTQB Foundation Certification
16 2 (0.17%) PMP
Quality Assurance & Compliance
1 67 (5.75%) QA
2 20 (1.72%) Accessibility
2 20 (1.72%) GDPR
3 15 (1.29%) PCI DSS
4 13 (1.11%) Sarbanes-Oxley
5 4 (0.34%) ISO/IEC 27001
6 3 (0.26%) GRC
6 3 (0.26%) SLA
7 1 (0.086%) COBIT
7 1 (0.086%) Data Quality
7 1 (0.086%) HIPAA
7 1 (0.086%) SOC 2
System Software
1 121 (10.38%) Docker
2 24 (2.06%) Active Directory
3 14 (1.20%) VMware Infrastructure
4 6 (0.51%) VMware ESXi
5 4 (0.34%) Virtual Machines
6 3 (0.26%) Firmware
7 2 (0.17%) Squid
7 2 (0.17%) VMware NSX
7 2 (0.17%) vSphere
8 1 (0.086%) HDFS
8 1 (0.086%) Hyper-V
8 1 (0.086%) Virtual Servers
Systems Management
1 91 (7.80%) Terraform
2 88 (7.55%) Kubernetes
3 22 (1.89%) Grafana
4 17 (1.46%) Prometheus
5 9 (0.77%) Ansible
6 6 (0.51%) Functional Safety
7 5 (0.43%) Microsoft Intune
8 2 (0.17%) Argo
8 2 (0.17%) Kibana
9 1 (0.086%) Single Sign-On
Vendors
1 258 (22.13%) Microsoft
2 26 (2.23%) Oracle
3 22 (1.89%) Xamarin
4 18 (1.54%) Salesforce
5 17 (1.46%) Sage
6 16 (1.37%) VMware
7 14 (1.20%) DevExpress
8 11 (0.94%) Databricks
8 11 (0.94%) Google
9 10 (0.86%) Splunk
10 8 (0.69%) IBM
10 8 (0.69%) Infor
11 7 (0.60%) IFS
11 7 (0.60%) Rollbar
12 6 (0.51%) Apple
12 6 (0.51%) AVEVA
12 6 (0.51%) Dell
12 6 (0.51%) Rockwell
12 6 (0.51%) Siemens
13 5 (0.43%) Red Hat