Platform Engineering Jobs

Platform Engineering
UK

The table below provides summary statistics for permanent job vacancies requiring Platform Engineering skills. It includes a benchmarking guide to the annual salaries offered in vacancies that cited Platform Engineering over the 6 months leading up to 30 April 2025, comparing them to the same period in the previous two years.

6 months to
30 Apr 2025
Same period 2024 Same period 2023
Rank 303 323 315
Rank change year-on-year +20 -8 +60
Permanent jobs citing Platform Engineering 478 867 1,142
As % of all permanent jobs advertised in the UK 0.92% 0.88% 1.10%
As % of the Processes & Methodologies category 0.98% 1.03% 1.15%
Number of salaries quoted 346 430 770
10th Percentile £53,750 £51,125 £51,700
25th Percentile £56,176 £60,000 £60,000
Median annual salary (50th Percentile) £72,500 £75,000 £75,000
Median % change year-on-year -3.33% - +3.45%
75th Percentile £90,000 £93,750 £100,000
90th Percentile £110,000 £112,500 £125,000
UK excluding London median annual salary £66,250 £65,000 £67,500
% change year-on-year +1.92% -3.70% +12.50%

All Process and Methodology Skills
UK

Platform Engineering falls under the Processes and Methodologies category. For comparison with the information above, the following table provides summary statistics for all permanent job vacancies requiring process or methodology skills.

Permanent vacancies with a requirement for process or methodology skills 48,641 84,574 99,457
As % of all permanent jobs advertised in the UK 93.26% 86.00% 95.63%
Number of salaries quoted 26,531 59,798 58,397
10th Percentile £30,580 £29,000 £34,000
25th Percentile £42,500 £40,000 £45,000
Median annual salary (50th Percentile) £57,500 £55,000 £61,500
Median % change year-on-year +4.55% -10.57% +2.50%
75th Percentile £76,250 £72,500 £82,500
90th Percentile £98,750 £92,500 £100,000
UK excluding London median annual salary £52,500 £50,000 £55,000
% change year-on-year +5.00% -9.09% +4.76%

Platform Engineering
Job Vacancy Trend

Job postings citing Platform Engineering as a proportion of all IT jobs advertised.
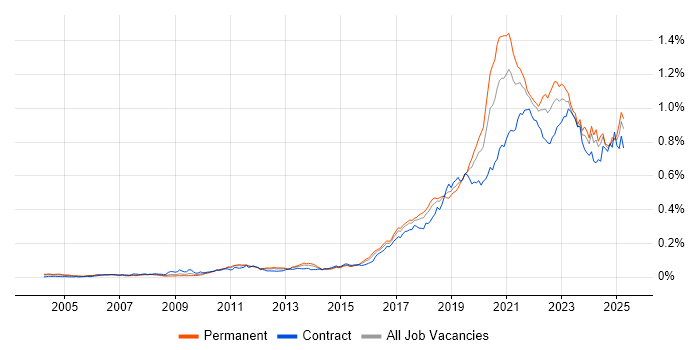
Job vacancy trend for Platform Engineering in the UK

Platform Engineering
Salary Trend

3-month moving average salary quoted in jobs citing Platform Engineering.

Salary trend for Platform Engineering in the UK

Platform Engineering
Salary Histogram

Salary distribution for jobs citing Platform Engineering over the 6 months to 30 April 2025.

Salary histogram for Platform Engineering in the UK

Platform Engineering
Top 16 Job Locations

The table below looks at the demand and provides a guide to the median salaries quoted in IT jobs citing Platform Engineering within the UK over the 6 months to 30 April 2025. The 'Rank Change' column provides an indication of the change in demand within each location based on the same 6 month period last year.

Location Rank Change
on Same Period
Last Year
Matching
Permanent
IT Job Ads
Median Salary
Past 6 Months
Median Salary
% Change
on Same Period
Last Year
Live
Jobs
England +14 454 £72,500 -3.33% 328
UK excluding London +8 263 £66,250 +1.92% 172
London +43 195 £85,000 +3.03% 172
Work from Home +72 135 £72,500 -3.33% 221
North of England +27 119 £57,560 -4.07% 84
North West +49 101 £57,560 -11.45% 56
South East +51 78 £55,000 -18.52% 24
South West +51 24 £77,500 +14.81% 23
Midlands +1 18 £67,500 +12.50% 13
West Midlands +29 17 £67,500 +3.85% 10
Yorkshire +12 16 £65,000 +18.18% 21
Scotland +104 14 £75,360 +3.94% 12
East of England +44 6 £77,500 - 10
Wales +31 4 £56,177 +2.14%
North East +27 2 £74,000 -4.52% 7
East Midlands +11 1 £100,000 +66.67% 2

Platform Engineering
Co-occurring Skills and Capabilities by Category

The follow tables expand on the table above by listing co-occurrences grouped by category. The same employment type, locality and period is covered with up to 20 co-occurrences shown in each of the following categories:

Application Platforms
1 15 (3.14%) Apache Airflow
2 13 (2.72%) Apache Spark
3 12 (2.51%) Apache
4 9 (1.88%) Microsoft Exchange
5 7 (1.46%) IBM Domino
6 6 (1.26%) Confluence
6 6 (1.26%) Tomcat
7 5 (1.05%) NetWeaver
8 4 (0.84%) SharePoint
9 2 (0.42%) Jupyter
9 2 (0.42%) OpenStack
10 1 (0.21%) Jetty
Applications
1 4 (0.84%) Chatbot
2 3 (0.63%) Mozilla Thunderbird
3 1 (0.21%) Microsoft Excel
Business Applications
1 65 (13.60%) Sparx Enterprise Architect
1 65 (13.60%) Teamcenter
2 5 (1.05%) Oracle Subledger Accounting
3 4 (0.84%) Remedy ITSM
4 2 (0.42%) Oracle BPM
5 1 (0.21%) Dynamics CRM
Cloud Services
1 192 (40.17%) Azure
2 181 (37.87%) AWS
3 71 (14.85%) GCP
4 62 (12.97%) GitHub
5 59 (12.34%) Azure DevOps
6 43 (9.00%) PaaS
7 31 (6.49%) GitHub Actions
7 31 (6.49%) IaaS
7 31 (6.49%) Pulumi
7 31 (6.49%) SaaS
8 30 (6.28%) Serverless
9 29 (6.07%) Amazon S3
10 22 (4.60%) Entra ID
11 21 (4.39%) AWS CloudFormation
11 21 (4.39%) Microsoft 365
12 20 (4.18%) AWS Lambda
13 19 (3.97%) Amazon EC2
14 18 (3.77%) Azure Monitor
15 16 (3.35%) Cloud Computing
15 16 (3.35%) Virtual Private Cloud
Communications & Networking
1 21 (4.39%) DNS
2 14 (2.93%) Firewall
3 13 (2.72%) VPN
4 10 (2.09%) WAN
5 9 (1.88%) DHCP
6 8 (1.67%) TCP/IP
7 7 (1.46%) Cisco IOS
7 7 (1.46%) LAN
8 6 (1.26%) HTTP
9 3 (0.63%) SD-WAN
9 3 (0.63%) SSL
10 2 (0.42%) Internet
10 2 (0.42%) VXLAN
11 1 (0.21%) BGP
11 1 (0.21%) LTE
11 1 (0.21%) MPLS
11 1 (0.21%) Network Security
11 1 (0.21%) SAN
11 1 (0.21%) TETRA
11 1 (0.21%) Wireless
Database & Business Intelligence
1 18 (3.77%) Data Lake
2 17 (3.56%) SQL Server
3 11 (2.30%) Amazon RDS
3 11 (2.30%) DynamoDB
4 9 (1.88%) Azure SQL Database
4 9 (1.88%) Data Warehouse
5 8 (1.67%) PostgreSQL
6 7 (1.46%) Elasticsearch
6 7 (1.46%) Hadoop
7 6 (1.26%) MySQL
7 6 (1.26%) Power BI
8 5 (1.05%) Big Data
8 5 (1.05%) BusinessObjects
8 5 (1.05%) HBase
8 5 (1.05%) MongoDB
8 5 (1.05%) SAP BW
8 5 (1.05%) SAP Data Services
8 5 (1.05%) SAP HANA
9 4 (0.84%) Amazon Redshift
9 4 (0.84%) Redis
Development Applications
1 65 (13.60%) Rational DOORS
2 47 (9.83%) Jenkins
3 41 (8.58%) GitLab
4 19 (3.97%) Sonatype Nexus
5 18 (3.77%) SonarQube
6 14 (2.93%) JIRA
7 12 (2.51%) TeamCity
8 11 (2.30%) Git
9 8 (1.67%) Oracle Forms
10 5 (1.05%) Artifactory
10 5 (1.05%) Cypress.io
10 5 (1.05%) Vite
10 5 (1.05%) webpack
11 4 (0.84%) Octopus Deploy
11 4 (0.84%) Vagrant
12 3 (0.63%) Bitbucket Server
13 2 (0.42%) CircleCI
14 1 (0.21%) Bitbucket
14 1 (0.21%) Jaeger
14 1 (0.21%) Team Foundation Server
General
1 99 (20.71%) Social Skills
2 87 (18.20%) Finance
3 62 (12.97%) Law
4 31 (6.49%) Banking
5 17 (3.56%) Public Sector
6 12 (2.51%) Analytical Skills
7 11 (2.30%) Front Office
8 10 (2.09%) Marketing
9 8 (1.67%) Manufacturing
10 7 (1.46%) Advertising
10 7 (1.46%) Inclusion and Diversity
10 7 (1.46%) Legal
10 7 (1.46%) Retail
11 6 (1.26%) Games
12 5 (1.05%) General Ledger
13 4 (0.84%) Financial Institution
13 4 (0.84%) Presentation Skills
14 3 (0.63%) Organisational Skills
15 2 (0.42%) Investment Banking
16 1 (0.21%) Russian Language
Job Titles
1 255 (53.35%) Platform Engineer
2 82 (17.15%) Systems Engineer
3 79 (16.53%) Senior
4 74 (15.48%) Lead
5 66 (13.81%) DevOps Engineer
6 52 (10.88%) Cloud Engineer
7 49 (10.25%) Cloud Platform Engineer
8 41 (8.58%) Azure Engineer
9 35 (7.32%) Senior Platform Engineer
10 33 (6.90%) DevOps Platform Engineer
11 31 (6.49%) Data Engineer
12 26 (5.44%) Azure Platform Engineer
13 25 (5.23%) Python Engineer
14 24 (5.02%) AWS Engineer
15 20 (4.18%) Infrastructure Engineer
15 20 (4.18%) Linux Engineer
15 20 (4.18%) Software Engineer
16 16 (3.35%) Lead Data Engineer
16 16 (3.35%) Principal Engineer
16 16 (3.35%) Support Engineer
Libraries, Frameworks & Software Standards
1 32 (6.69%) REST
2 26 (5.44%) Kafka
3 23 (4.81%) React
4 15 (3.14%) .NET
4 15 (3.14%) ARM Templates
5 13 (2.72%) Node.js
5 13 (2.72%) Spring Boot
5 13 (2.72%) YAML
6 12 (2.51%) AWS CDK
6 12 (2.51%) Loki
6 12 (2.51%) Spring
7 10 (2.09%) ADO
8 7 (1.46%) Elastic Stack
8 7 (1.46%) Web Services
9 6 (1.26%) Next.js
10 5 (1.05%) Enzyme
10 5 (1.05%) Jest
10 5 (1.05%) Parceljs
10 5 (1.05%) Vue
10 5 (1.05%) WebAssembly
Miscellaneous
1 69 (14.44%) Product Ownership
2 36 (7.53%) Cloud Native
3 34 (7.11%) Public Cloud
4 24 (5.02%) Enterprise Software
5 12 (2.51%) Distributed Systems
5 12 (2.51%) Hybrid Cloud
6 11 (2.30%) Data Centre
6 11 (2.30%) Distributed Computing
7 10 (2.09%) Greenfield Project
8 9 (1.88%) Algorithms
8 9 (1.88%) Clustering
9 8 (1.67%) Management Information System
10 6 (1.26%) Data Protection Act
10 6 (1.26%) Derivative
11 5 (1.05%) Hedge funds
12 4 (0.84%) Linux Command Line
12 4 (0.84%) Replication
12 4 (0.84%) Virtual Team
13 3 (0.63%) Low-Code
13 3 (0.63%) Private Cloud
Operating Systems
1 93 (19.46%) Linux
2 39 (8.16%) Windows
3 24 (5.02%) Windows Server
4 23 (4.81%) Red Hat Enterprise Linux
5 9 (1.88%) Unix
6 8 (1.67%) Android
6 8 (1.67%) Windows Server 2016
7 7 (1.46%) Mac OS
8 5 (1.05%) AIX
8 5 (1.05%) VMS
9 3 (0.63%) CentOS
9 3 (0.63%) Ubuntu
9 3 (0.63%) Windows Server 2008
9 3 (0.63%) Windows Server 2012
9 3 (0.63%) Windows Server 2019
10 2 (0.42%) Solaris
Processes & Methodologies
1 227 (47.49%) CI/CD
2 195 (40.79%) DevOps
3 167 (34.94%) Agile
4 164 (34.31%) Infrastructure as Code
5 98 (20.50%) Containerisation
6 74 (15.48%) Analytics
7 71 (14.85%) Stakeholder Engagement
8 65 (13.60%) ArchiMate
8 65 (13.60%) MODAF
8 65 (13.60%) Model-Based Systems Engineering
8 65 (13.60%) Programme Delivery
8 65 (13.60%) SysML
8 65 (13.60%) TOGAF
9 56 (11.72%) Artificial Intelligence
9 56 (11.72%) Computer Science
10 54 (11.30%) Technical Leadership
11 52 (10.88%) Problem-Solving
12 48 (10.04%) Site Reliability Engineering
12 48 (10.04%) Software Engineering
13 47 (9.83%) Microservices
Programming Languages
1 217 (45.40%) Python
2 70 (14.64%) Java
3 66 (13.81%) PowerShell
4 63 (13.18%) Bash
5 51 (10.67%) Bicep
6 48 (10.04%) Go
7 45 (9.41%) SQL
8 31 (6.49%) Ruby
9 30 (6.28%) TypeScript
10 23 (4.81%) Scala
11 22 (4.60%) C#
12 15 (3.14%) JavaScript
13 13 (2.72%) Rust
14 10 (2.09%) C
15 8 (1.67%) Perl
16 7 (1.46%) C++
17 6 (1.26%) Clojure
17 6 (1.26%) Elixir
18 5 (1.05%) Groovy
19 4 (0.84%) T-SQL
Qualifications
1 127 (26.57%) Degree
2 74 (15.48%) BPSS Clearance
3 65 (13.60%) TOGAF Certification
4 32 (6.69%) Security Cleared
5 29 (6.07%) SC Cleared
6 28 (5.86%) Computer Science Degree
7 20 (4.18%) Master's Degree
8 13 (2.72%) Azure Certification
9 11 (2.30%) DV Cleared
9 11 (2.30%) Microsoft Certification
10 9 (1.88%) HNC
11 5 (1.05%) AWS Certification
12 2 (0.42%) Cisco Certification
13 1 (0.21%) CCIE
13 1 (0.21%) CCNP
13 1 (0.21%) CCSP
13 1 (0.21%) CISSP
13 1 (0.21%) MCSE
13 1 (0.21%) VCAP
13 1 (0.21%) VMware Certified Professional (VCP)
Quality Assurance & Compliance
1 16 (3.35%) Accessibility
2 13 (2.72%) GDPR
3 5 (1.05%) Data Quality
3 5 (1.05%) ISO/IEC 27001
4 4 (0.84%) QA
4 4 (0.84%) Sarbanes-Oxley
5 2 (0.42%) California Consumer Privacy Act
5 2 (0.42%) NIST
5 2 (0.42%) PCI DSS
6 1 (0.21%) Cyber Essentials
6 1 (0.21%) SOC 2
System Software
1 134 (28.03%) Docker
2 32 (6.69%) VMware Infrastructure
3 31 (6.49%) Active Directory
4 14 (2.93%) Virtual Desktop
4 14 (2.93%) Virtual Machines
5 10 (2.09%) VMware ESXi
6 7 (1.46%) Hyper-V
7 5 (1.05%) vSphere
8 2 (0.42%) Firmware
8 2 (0.42%) HDFS
9 1 (0.21%) Veritas Cluster Server
Systems Management
1 190 (39.75%) Terraform
2 177 (37.03%) Kubernetes
3 113 (23.64%) Ansible
4 45 (9.41%) Puppet
5 44 (9.21%) Progress Chef
6 27 (5.65%) Prometheus
7 25 (5.23%) Grafana
8 22 (4.60%) Podman
9 5 (1.05%) Argo
9 5 (1.05%) Packer
9 5 (1.05%) Tivoli Storage Manager
10 4 (0.84%) Active Directory Federation Services
10 4 (0.84%) Red Hat Satellite
10 4 (0.84%) SCCM
11 3 (0.63%) Nagios
11 3 (0.63%) Nessus
11 3 (0.63%) Proxmox
11 3 (0.63%) Rancher
12 2 (0.42%) Consul
12 2 (0.42%) Hadoop YARN
Vendors
1 67 (14.02%) Microsoft
2 65 (13.60%) Sparx
3 40 (8.37%) VMware
4 23 (4.81%) Databricks
4 23 (4.81%) Google
5 18 (3.77%) Oracle
6 17 (3.56%) Citrix
7 11 (2.30%) Cisco
7 11 (2.30%) Red Hat
8 10 (2.09%) IBM
9 8 (1.67%) Palo Alto
10 7 (1.46%) Atlassian
11 6 (1.26%) Hitachi
11 6 (1.26%) ServiceNow
12 5 (1.05%) Cloudera
12 5 (1.05%) OpenAI
12 5 (1.05%) SAP
13 4 (0.84%) IBM Sterling
13 4 (0.84%) Remedy
14 3 (0.63%) TOWER Software