Programme Management Jobs in the UK excluding London

Programme Management (Program Management)
UK > UK excluding London

The following table provides summary statistics for permanent job vacancies advertised in the UK excluding London with a requirement for Programme Management skills. Included is a benchmarking guide to the salaries offered in vacancies that have cited Programme Management over the 6 months to 3 May 2024 with a comparison to the same period in the previous 2 years.

6 months to
3 May 2024
Same period 2023 Same period 2022
Rank 301 333 239
Rank change year-on-year +32 -94 +43
Permanent jobs citing Programme Management 613 593 1,096
As % of all permanent jobs advertised in the UK excluding London 0.87% 0.96% 1.54%
As % of the Processes & Methodologies category 1.03% 1.01% 1.64%
Number of salaries quoted 319 333 685
10th Percentile £32,750 £35,250 £35,000
25th Percentile £40,000 £45,512 £41,250
Median annual salary (50th Percentile) £52,000 £58,500 £52,500
Median % change year-on-year -11.11% +11.43% +5.00%
75th Percentile £67,500 £73,750 £65,250
90th Percentile £98,500 £82,350 £82,500
UK median annual salary £55,000 £66,125 £58,135
% change year-on-year -16.82% +13.74% -6.98%

All Process and Methodology Skills
UK excluding London

Programme Management is in the Processes and Methodologies category. The following table is for comparison with the above and provides summary statistics for all permanent job vacancies advertised in the UK excluding London with a requirement for process or methodology skills.

Permanent vacancies with a requirement for process or methodology skills 59,415 58,778 66,796
As % of all permanent jobs advertised in the UK excluding London 84.38% 95.62% 94.04%
Number of salaries quoted 41,129 30,196 41,543
10th Percentile £27,117 £30,500 £30,000
25th Percentile £36,250 £40,000 £38,750
Median annual salary (50th Percentile) £50,000 £55,000 £52,500
Median % change year-on-year -9.09% +4.76% +9.38%
75th Percentile £65,000 £70,000 £67,500
90th Percentile £77,500 £82,500 £80,000
UK median annual salary £55,000 £61,500 £60,000
% change year-on-year -10.57% +2.50% +9.09%

Programme Management
Job Vacancy Trend in the UK excluding London

Job postings citing Programme Management as a proportion of all IT jobs advertised in the UK excluding London.
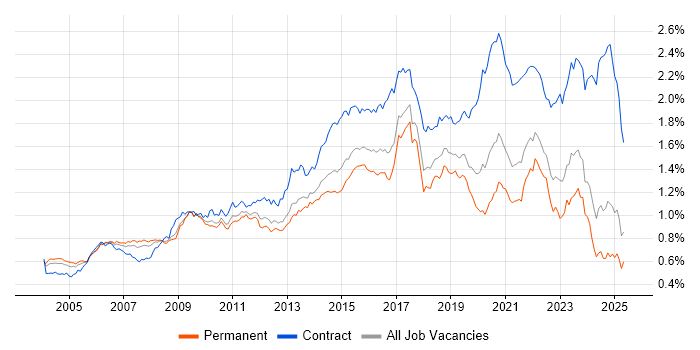
Job vacancy trend for Programme Management in the UK excluding London

Programme Management
Salary Trend in the UK excluding London

3-month moving average salary quoted in jobs citing Programme Management in the UK excluding London.

Salary trend for Programme Management in the UK excluding London

Programme Management
Salary Histogram in the UK excluding London

Salary distribution for jobs citing Programme Management in the UK excluding London over the 6 months to 3 May 2024.

Salary histogram for Programme Management in the UK excluding London

Programme Management
Job Locations in the UK excluding London

The table below looks at the demand and provides a guide to the median salaries quoted in IT jobs citing Programme Management within the UK excluding London region over the 6 months to 3 May 2024. The 'Rank Change' column provides an indication of the change in demand within each location based on the same 6 month period last year.

Location Rank Change
on Same Period
Last Year
Matching
Permanent
IT Job Ads
Median Salary
Past 6 Months
Median Salary
% Change
on Same Period
Last Year
Live
Jobs
South East -5 195 £54,151 -16.69% 56
South West -25 103 £63,500 +16.30% 25
Midlands +34 100 £51,997 -5.46% 29
West Midlands +27 71 £47,500 -11.63% 19
North of England +27 68 £50,685 -22.62% 58
Scotland -26 58 £50,000 -16.67% 12
North West +10 46 £50,685 -24.91% 38
Northern Ireland - 39 £35,000 - 8
East of England -14 32 £53,555 -27.14% 29
East Midlands +7 29 £55,000 -8.73% 9
Wales +15 19 £52,738 +2.26% 6
North East +1 12 £39,000 -36.84% 3
Yorkshire +47 10 £51,997 -13.34% 17
Programme Management
UK

Programme Management
Co-occurring Skills and Capabilities in the UK excluding London by Category

The follow tables expand on the table above by listing co-occurrences grouped by category. The same employment type, locality and period is covered with up to 20 co-occurrences shown in each of the following categories:

Application Platforms
1 41 (6.69%) SharePoint
2 9 (1.47%) WordPress
3 7 (1.14%) MS Project Server
4 6 (0.98%) Apache
4 6 (0.98%) nginx
5 5 (0.82%) Confluence
6 3 (0.49%) CMS
7 2 (0.33%) Microsoft Exchange
8 1 (0.16%) Ethereum
8 1 (0.16%) Hyperledger
Applications
1 91 (14.85%) Microsoft Excel
2 75 (12.23%) Microsoft Project
3 44 (7.18%) Microsoft Office
4 26 (4.24%) Microsoft PowerPoint
5 6 (0.98%) OrCAD
5 6 (0.98%) Spreadsheet
6 4 (0.65%) Doxygen
6 4 (0.65%) InfoPath
6 4 (0.65%) MS Visio
7 3 (0.49%) Chatbot
8 2 (0.33%) Fusion 360
9 1 (0.16%) Adobe After Effects
9 1 (0.16%) Adobe Creative Suite
9 1 (0.16%) Adobe Premiere
9 1 (0.16%) AutoCAD
9 1 (0.16%) Revit
9 1 (0.16%) Simulink
Business Applications
1 57 (9.30%) Primavera
2 3 (0.49%) Oracle ERP
2 3 (0.49%) Salesforce CRM
3 2 (0.33%) CA PPM
4 1 (0.16%) Distributed Ledger
4 1 (0.16%) NetSuite
4 1 (0.16%) Oracle EBS
4 1 (0.16%) Oracle EBS R12
4 1 (0.16%) Oracle Procure-to-Pay
4 1 (0.16%) SAP ERP
Cloud Services
1 49 (7.99%) Azure
2 41 (6.69%) AWS
3 27 (4.40%) Microsoft 365
4 22 (3.59%) Power Platform
5 17 (2.77%) Smartsheet
6 10 (1.63%) Cloud Computing
6 10 (1.63%) GitHub
7 9 (1.47%) Azure DevOps
7 9 (1.47%) Google Drive
8 8 (1.31%) SaaS
9 7 (1.14%) GCP
9 7 (1.14%) OneDrive
10 6 (0.98%) ChatGPT
10 6 (0.98%) GitHub Actions
11 5 (0.82%) AWS IoT
11 5 (0.82%) PowerApps
12 4 (0.65%) Entra ID
12 4 (0.65%) PaaS
12 4 (0.65%) WhatsApp
13 3 (0.49%) Azure Data Factory
Communications & Networking
1 22 (3.59%) Network Security
2 18 (2.94%) Wireless
3 16 (2.61%) HTTP
3 16 (2.61%) MQTT
4 15 (2.45%) Wi-Fi
5 10 (1.63%) Modbus
6 9 (1.47%) Ethernet
6 9 (1.47%) TCP/IP
7 8 (1.31%) 3G
7 8 (1.31%) 4G
7 8 (1.31%) DNS
7 8 (1.31%) LTE
7 8 (1.31%) SD-WAN
8 7 (1.14%) Bluetooth
9 6 (0.98%) GPRS
9 6 (0.98%) LoRaWAN
10 5 (0.82%) Firewall
11 4 (0.65%) FTP
11 4 (0.65%) RS-485
12 3 (0.49%) LAN
Database & Business Intelligence
1 22 (3.59%) PostgreSQL
2 17 (2.77%) Power BI
3 13 (2.12%) Tableau
4 9 (1.47%) BusinessObjects
5 7 (1.14%) SQLite
6 6 (0.98%) GIS
6 6 (0.98%) Redis
7 5 (0.82%) Relational Database
8 4 (0.65%) Electronic Patient Records
8 4 (0.65%) MongoDB
9 3 (0.49%) Data Warehouse
9 3 (0.49%) SQL Server
10 2 (0.33%) Big Data
10 2 (0.33%) Data Lake
10 2 (0.33%) MySQL
10 2 (0.33%) Oracle Reports
11 1 (0.16%) OLAP
Development Applications
1 31 (5.06%) Git
2 29 (4.73%) JIRA
3 15 (2.45%) Subversion
4 12 (1.96%) Visual Studio
5 11 (1.79%) Eclipse
6 7 (1.14%) Jenkins
7 5 (0.82%) Maven
8 4 (0.65%) Bitbucket
8 4 (0.65%) GitLab
9 2 (0.33%) LabVIEW
9 2 (0.33%) Selenium
9 2 (0.33%) WebDriver
10 1 (0.16%) TeamCity
General
1 238 (38.83%) Finance
1 238 (38.83%) Social Skills
2 197 (32.14%) Public Sector
3 162 (26.43%) Manufacturing
4 154 (25.12%) Telecoms
5 153 (24.96%) Marketing
6 140 (22.84%) Electronics
7 92 (15.01%) Analytical Skills
8 39 (6.36%) Presentation Skills
9 30 (4.89%) Legal
10 29 (4.73%) Inclusion and Diversity
11 27 (4.40%) Law
12 25 (4.08%) Organisational Skills
13 23 (3.75%) Influencing Skills
13 23 (3.75%) Retail
14 20 (3.26%) Military
15 16 (2.61%) Financial Institution
16 12 (1.96%) Banking
17 11 (1.79%) Investment Banking
18 10 (1.63%) Games
Job Titles
1 146 (23.82%) Project Manager
2 111 (18.11%) Senior
3 81 (13.21%) Senior Manager
4 67 (10.93%) Senior Project Manager
5 52 (8.48%) Project Controller
6 42 (6.85%) Analyst
7 41 (6.69%) Software Engineer
8 34 (5.55%) IT Manager
9 30 (4.89%) Business Analyst
10 29 (4.73%) Consultant
10 29 (4.73%) Programme Manager
11 27 (4.40%) Developer
12 25 (4.08%) Electronics Engineer
13 23 (3.75%) Embedded Engineer
13 23 (3.75%) Support Engineer
14 21 (3.43%) Lead
15 19 (3.10%) IT Project Manager
15 19 (3.10%) Security Consultant
16 18 (2.94%) Applications Manager
17 17 (2.77%) Customer Support Engineer
Libraries, Frameworks & Software Standards
1 32 (5.22%) HTML
2 28 (4.57%) React
3 25 (4.08%) CSS
4 21 (3.43%) AngularJS
5 19 (3.10%) Flask
6 14 (2.28%) Django
7 12 (1.96%) Spring
8 8 (1.31%) Svelte
9 7 (1.14%) HTML5
9 7 (1.14%) Qt
10 6 (0.98%) Celery
10 6 (0.98%) Dask
10 6 (0.98%) GeoJSON
10 6 (0.98%) GeoPandas
10 6 (0.98%) LAPP Stack
10 6 (0.98%) Node.js
10 6 (0.98%) NumPy
10 6 (0.98%) Yocto
11 5 (0.82%) Electron
11 5 (0.82%) Vaadin
Miscellaneous
1 26 (4.24%) Self-Motivation
2 21 (3.43%) IoT
2 21 (3.43%) Product Ownership
3 18 (2.94%) Cyber Defence
3 18 (2.94%) Embedded Systems
3 18 (2.94%) NHS
3 18 (2.94%) Security Operations Centre
4 14 (2.28%) Enterprise Software
4 14 (2.28%) Management Information System
5 13 (2.12%) Onboarding
6 12 (1.96%) FPGA
7 11 (1.79%) Algorithms
7 11 (1.79%) Driving Licence
8 10 (1.63%) Arduino
9 9 (1.47%) PMI
9 9 (1.47%) VHDL
10 8 (1.31%) Raspberry Pi
10 8 (1.31%) Team-Oriented Environment
10 8 (1.31%) Verilog
11 7 (1.14%) NB-IoT
Operating Systems
1 51 (8.32%) Linux
2 31 (5.06%) Windows
3 4 (0.65%) VMS
4 3 (0.49%) Embedded Linux
5 2 (0.33%) Android
6 1 (0.16%) Unix
Processes & Methodologies
1 220 (35.89%) Project Management
2 168 (27.41%) Agile
3 159 (25.94%) Business Intelligence
4 140 (22.84%) Digital Marketing
5 130 (21.21%) Risk Management
6 121 (19.74%) Problem-Solving
7 104 (16.97%) Change Management
8 91 (14.85%) PRINCE2
9 88 (14.36%) Business Case
10 86 (14.03%) Project Delivery
11 72 (11.75%) Coaching
12 70 (11.42%) Decision-Making
12 70 (11.42%) Mentoring
13 69 (11.26%) Software Engineering
14 67 (10.93%) Stakeholder Management
15 65 (10.60%) Systems Engineering
16 58 (9.46%) Performance Management
17 55 (8.97%) Actionable Insight
18 54 (8.81%) Continuous Improvement
19 52 (8.48%) Earned Value Management
Programming Languages
1 63 (10.28%) Python
2 53 (8.65%) C
3 45 (7.34%) JavaScript
4 39 (6.36%) C++
5 35 (5.71%) SQL
6 32 (5.22%) Java
7 23 (3.75%) C#
8 16 (2.61%) Embedded C
9 15 (2.45%) TypeScript
10 9 (1.47%) PHP
10 9 (1.47%) PowerShell
11 8 (1.31%) Embedded C++
11 8 (1.31%) Go
11 8 (1.31%) MATLAB
12 7 (1.14%) Bash
13 5 (0.82%) Assembly Language
14 4 (0.65%) Bicep
15 3 (0.49%) R
16 2 (0.33%) T-SQL
17 1 (0.16%) Kusto Query Language
Qualifications
1 154 (25.12%) Degree
2 117 (19.09%) Security Cleared
3 63 (10.28%) SC Cleared
4 44 (7.18%) PRINCE2 Practitioner
5 31 (5.06%) DV Cleared
6 19 (3.10%) PMI Certification
7 16 (2.61%) Computer Science Degree
8 13 (2.12%) HNC
9 11 (1.79%) PMP
10 10 (1.63%) CCNP
10 10 (1.63%) Cisco Certification
10 10 (1.63%) Master's Degree
11 9 (1.47%) BPSS Clearance
12 8 (1.31%) AWS Certification
12 8 (1.31%) CCNA
12 8 (1.31%) CCSA
13 6 (0.98%) DBS Check
14 5 (0.82%) CSPO
14 5 (0.82%) PRINCE2 Certification
15 4 (0.65%) HND
Quality Assurance & Compliance
1 51 (8.32%) PMO
2 43 (7.01%) QA
3 20 (3.26%) NIST
4 19 (3.10%) NIST 800
5 13 (2.12%) ISO 9001
6 12 (1.96%) ISO/IEC 27001
7 11 (1.79%) Accessibility
8 9 (1.47%) Sarbanes-Oxley
9 8 (1.31%) ISO/IEC 20000
10 4 (0.65%) IEC 61131
10 4 (0.65%) ISO 9000
10 4 (0.65%) JTAG
11 2 (0.33%) Cyber Essentials
11 2 (0.33%) ISO 26262
11 2 (0.33%) MISRA
11 2 (0.33%) P3O
11 2 (0.33%) PCI DSS
11 2 (0.33%) SLA
11 2 (0.33%) SOC 2
12 1 (0.16%) Cyber Essentials PLUS
System Software
1 40 (6.53%) Firmware
2 13 (2.12%) Embedded Firmware
3 7 (1.14%) Docker
4 1 (0.16%) Active Directory
Systems Management
1 16 (2.61%) Terraform
2 7 (1.14%) Kubernetes
3 1 (0.16%) EMC NetWorker
3 1 (0.16%) IBM BigFix
3 1 (0.16%) Tivoli
Vendors
1 152 (24.80%) SAP
2 115 (18.76%) Microsoft
3 22 (3.59%) Google
4 12 (1.96%) Oracle
5 10 (1.63%) Cisco
5 10 (1.63%) EMC
6 9 (1.47%) CheckPoint
6 9 (1.47%) Salesforce
6 9 (1.47%) Xero
7 8 (1.31%) NVIDIA
8 6 (0.98%) Meraki
9 5 (0.82%) Automation Anywhere
9 5 (0.82%) iManage
10 4 (0.65%) Cognos
11 3 (0.49%) Thales
11 3 (0.49%) Workday
11 3 (0.49%) Xilinx
12 2 (0.33%) Apple
12 2 (0.33%) Atlassian
12 2 (0.33%) CA Agile Central