Risk Management Jobs in the UK excluding London

Risk Management
UK > UK excluding London

The table below provides summary statistics for permanent job vacancies advertised in the UK excluding London requiring Risk Management skills. It includes a benchmarking guide to the annual salaries offered in vacancies that cited Risk Management over the 6 months leading up to 30 May 2025, comparing them to the same period in the previous two years.

6 months to
30 May 2025
Same period 2024 Same period 2023
Rank 59 78 137
Rank change year-on-year +19 +59 -48
Permanent jobs citing Risk Management 1,758 2,373 1,549
As % of all permanent jobs advertised in the UK excluding London 4.46% 3.18% 2.67%
As % of the Processes & Methodologies category 4.82% 3.86% 2.79%
Number of salaries quoted 560 1,020 699
10th Percentile £46,250 £38,002 £36,250
25th Percentile £51,645 £46,250 £45,000
Median annual salary (50th Percentile) £58,500 £57,500 £56,000
Median % change year-on-year +1.74% +2.68% +1.51%
75th Percentile £74,258 £70,250 £75,000
90th Percentile £87,500 £85,000 £87,435
UK median annual salary £69,373 £60,000 £65,000
% change year-on-year +15.62% -7.69% -

All Process and Methodology Skills
UK excluding London

Risk Management falls under the Processes and Methodologies category. For comparison with the information above, the following table provides summary statistics for all permanent job vacancies requiring process or methodology skills in the UK excluding London.

Permanent vacancies with a requirement for process or methodology skills 36,483 61,419 55,450
As % of all permanent jobs advertised in the UK excluding London 92.65% 82.37% 95.58%
Number of salaries quoted 17,392 42,187 28,711
10th Percentile £26,250 £27,250 £30,500
25th Percentile £36,750 £36,250 £40,000
Median annual salary (50th Percentile) £51,574 £50,000 £55,000
Median % change year-on-year +3.15% -9.09% +4.76%
75th Percentile £65,000 £65,000 £70,000
90th Percentile £77,500 £77,500 £82,500
UK median annual salary £57,443 £55,000 £60,899
% change year-on-year +4.44% -9.69% +1.50%

Risk Management
Job Vacancy Trend in the UK excluding London

Job postings citing Risk Management as a proportion of all IT jobs advertised in the UK excluding London.
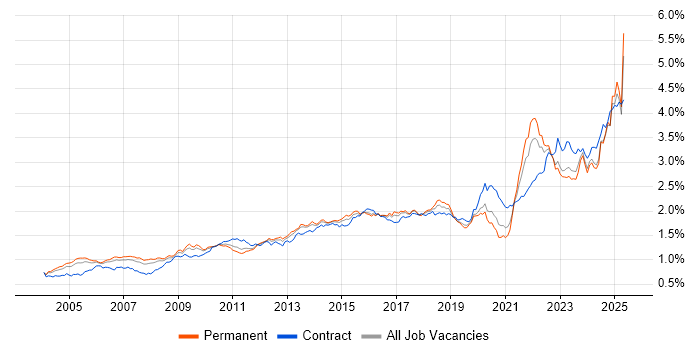
Job vacancy trend for Risk Management in the UK excluding London

Risk Management
Salary Trend in the UK excluding London

3-month moving average salary quoted in jobs citing Risk Management in the UK excluding London.

Salary trend for Risk Management in the UK excluding London

Risk Management
Salary Histogram in the UK excluding London

Salary distribution for jobs citing Risk Management in the UK excluding London over the 6 months to 30 May 2025.

Salary histogram for Risk Management in the UK excluding London

Risk Management
Job Locations in the UK excluding London

The table below looks at the demand and provides a guide to the median salaries quoted in IT jobs citing Risk Management within the UK excluding London region over the 6 months to 30 May 2025. The 'Rank Change' column provides an indication of the change in demand within each location based on the same 6 month period last year.

Location Rank Change
on Same Period
Last Year
Matching
Permanent
IT Job Ads
Median Salary
Past 6 Months
Median Salary
% Change
on Same Period
Last Year
Live
Jobs
North of England +55 576 £62,500 +13.64% 695
North West +54 471 £58,500 +9.18% 325
Midlands +44 348 £60,000 +9.79% 586
West Midlands +50 243 £55,000 -5.17% 320
Scotland -7 235 £51,645 -13.93% 180
South East -5 228 £70,500 +30.56% 1,121
South West +28 175 £55,000 -15.38% 400
East Midlands +28 105 £75,000 +38.89% 227
East of England +42 98 £55,000 +1.85% 451
Yorkshire +33 90 £71,991 +19.99% 287
Wales +80 71 £55,000 -24.14% 88
Northern Ireland +58 26 £78,901 +23.77% 53
North East +8 15 £71,250 +23.91% 85
Channel Islands - 3 £78,750 - 4
Risk Management
UK

Risk Management
Co-occurring Skills and Capabilities in the UK excluding London by Category

The follow tables expand on the table above by listing co-occurrences grouped by category. The same employment type, locality and period is covered with up to 20 co-occurrences shown in each of the following categories:

Application Platforms
1 31 (1.76%) SharePoint
2 24 (1.37%) Microsoft Exchange
3 21 (1.19%) Confluence
4 19 (1.08%) CMS
5 7 (0.40%) SAS
6 2 (0.11%) Apache Airflow
6 2 (0.11%) Apache Spark
6 2 (0.11%) IIS
6 2 (0.11%) Oracle Workflow
6 2 (0.11%) Tomcat
7 1 (0.057%) Apache
7 1 (0.057%) BizTalk Server
7 1 (0.057%) Oracle HTTP Server
7 1 (0.057%) WebLogic
Applications
1 160 (9.10%) Microsoft Office
2 41 (2.33%) Microsoft PowerPoint
3 32 (1.82%) Microsoft Excel
4 17 (0.97%) Microsoft Project
5 6 (0.34%) MS Visio
6 2 (0.11%) LaTeX
6 2 (0.11%) Oracle Smart View
6 2 (0.11%) Spreadsheet
7 1 (0.057%) Trello
Business Applications
1 5 (0.28%) SAP S/4HANA
2 4 (0.23%) Oracle ERP
3 2 (0.11%) Maximo
3 2 (0.11%) Oracle Assets
3 2 (0.11%) Oracle Cash Management
3 2 (0.11%) Oracle Financials
3 2 (0.11%) Oracle General Ledger
3 2 (0.11%) Oracle Payables
3 2 (0.11%) Oracle Receivables
3 2 (0.11%) SAP GRC
4 1 (0.057%) Dynamics CRM
4 1 (0.057%) iTrent
4 1 (0.057%) Remedy ITSM
4 1 (0.057%) Sage 200
4 1 (0.057%) SAP ERP
4 1 (0.057%) SAP FI
4 1 (0.057%) SAP FSCM
4 1 (0.057%) SAP GTS
Cloud Services
1 81 (4.61%) Azure
2 56 (3.19%) AWS
3 36 (2.05%) SaaS
4 34 (1.93%) PaaS
5 30 (1.71%) GCP
6 17 (0.97%) IaaS
6 17 (0.97%) iPaaS
6 17 (0.97%) Microsoft 365
7 15 (0.85%) Power Platform
8 13 (0.74%) Entra ID
9 8 (0.46%) Cloud Computing
10 6 (0.34%) Snowflake
11 5 (0.28%) Azure DevOps
11 5 (0.28%) OCI
12 4 (0.23%) Amazon EC2
12 4 (0.23%) Amazon S3
12 4 (0.23%) Amazon SageMaker
12 4 (0.23%) Amazon SQS
12 4 (0.23%) OneDrive
13 3 (0.17%) Route 53
Communications & Networking
1 271 (15.42%) VPN
2 260 (14.79%) Cisco IOS
3 46 (2.62%) Network Security
4 40 (2.28%) Firewall
5 19 (1.08%) Intrusion Detection
6 7 (0.40%) Intranet
7 6 (0.34%) LAN
7 6 (0.34%) WAN
7 6 (0.34%) Wireshark
8 5 (0.28%) DHCP
8 5 (0.28%) DMZ
8 5 (0.28%) DNS
9 4 (0.23%) Internet
10 3 (0.17%) HTTP
10 3 (0.17%) VLAN
11 2 (0.11%) Broadband
11 2 (0.11%) PPP
11 2 (0.11%) SD-WAN
11 2 (0.11%) Software-Defined Networking
11 2 (0.11%) Wi-Fi
Database & Business Intelligence
1 23 (1.31%) Tableau
2 20 (1.14%) NoSQL
3 18 (1.02%) Big Data
4 14 (0.80%) Data Warehouse
5 13 (0.74%) Power BI
6 11 (0.63%) Metadata
6 11 (0.63%) PostgreSQL
7 9 (0.51%) Data Lake
7 9 (0.51%) MS Access
7 9 (0.51%) SQL Server
8 6 (0.34%) Data Mining
9 5 (0.28%) MongoDB
10 4 (0.23%) Amazon Aurora
10 4 (0.23%) Amazon RDS
10 4 (0.23%) DynamoDB
10 4 (0.23%) Metadata Repository
10 4 (0.23%) MySQL
11 3 (0.17%) Ataccama
11 3 (0.17%) BusinessObjects
11 3 (0.17%) Oracle Database
Development Applications
1 33 (1.88%) JIRA
2 11 (0.63%) Git
3 7 (0.40%) Jenkins
4 6 (0.34%) JUnit
5 5 (0.28%) Maven
5 5 (0.28%) Mockito
6 4 (0.23%) SonarQube
7 3 (0.17%) AppScan
7 3 (0.17%) Bitbucket Server
7 3 (0.17%) Burp Suite
7 3 (0.17%) DbUnit
7 3 (0.17%) GitLab
7 3 (0.17%) jMock
7 3 (0.17%) Metasploit
8 2 (0.11%) ER Studio
8 2 (0.11%) ERwin
8 2 (0.11%) PowerDesigner
9 1 (0.057%) Oracle Forms
9 1 (0.057%) SQL Server Management Studio (SSMS)
9 1 (0.057%) Visual Studio
General
1 709 (40.33%) Social Skills
2 706 (40.16%) Finance
3 511 (29.07%) Analytical Skills
4 386 (21.96%) Inclusion and Diversity
5 149 (8.48%) Legal
6 128 (7.28%) Banking
7 125 (7.11%) Presentation Skills
8 88 (5.01%) Financial Institution
9 74 (4.21%) Law
10 73 (4.15%) Manufacturing
11 70 (3.98%) Marketing
12 62 (3.53%) Retail
13 55 (3.13%) Public Sector
14 54 (3.07%) Influencing Skills
15 47 (2.67%) German Language
16 39 (2.22%) Organisational Skills
17 32 (1.82%) Telecoms
18 31 (1.76%) French Language
19 22 (1.25%) Prime Brokerage
20 8 (0.46%) Pharmaceutical
Job Titles
1 397 (22.58%) Senior
2 338 (19.23%) Project Manager
3 267 (15.19%) Infrastructure Engineer
4 220 (12.51%) Analyst
5 208 (11.83%) Security Engineer
6 185 (10.52%) Senior Manager
7 172 (9.78%) Senior Project Manager
8 148 (8.42%) Principal Engineer
9 147 (8.36%) Principal Security Engineer
10 143 (8.13%) Risk Manager
11 120 (6.83%) Security Analyst
12 96 (5.46%) Lead
13 89 (5.06%) Architect
14 87 (4.95%) Principal Security Analyst
14 87 (4.95%) Product Analyst
15 60 (3.41%) Product Engineer
16 54 (3.07%) Delivery Project Manager
17 49 (2.79%) Senior Security Engineer
18 40 (2.28%) Credit Analyst
19 38 (2.16%) Technology Risk Manager
Libraries, Frameworks & Software Standards
1 260 (14.79%) Elastic Stack
2 15 (0.85%) SailPoint
3 14 (0.80%) Kafka
4 13 (0.74%) Spring
5 9 (0.51%) Middleware
5 9 (0.51%) React
5 9 (0.51%) RESTful
6 8 (0.46%) REST
7 7 (0.40%) .NET
7 7 (0.40%) Web Services
8 6 (0.34%) AngularJS
8 6 (0.34%) SOAP
8 6 (0.34%) Spring Boot
9 4 (0.23%) ActiveMQ
9 4 (0.23%) Bootstrap
9 4 (0.23%) Hibernate
9 4 (0.23%) JPA
9 4 (0.23%) Node.js
9 4 (0.23%) Spring Cloud
10 3 (0.17%) Spring Batch
Miscellaneous
1 270 (15.36%) Cyberattack
2 229 (13.03%) Management Information System
3 191 (10.86%) Driving Licence
4 86 (4.89%) Credit Risk
5 45 (2.56%) Blockchain
6 42 (2.39%) Product Ownership
7 36 (2.05%) Security Posture
8 32 (1.82%) Self-Motivation
9 31 (1.76%) Fixed Income
10 26 (1.48%) Virtual Team
11 25 (1.42%) Operational Technology
12 23 (1.31%) Robotics
13 22 (1.25%) Derivative
13 22 (1.25%) Hedge funds
14 18 (1.02%) Greenfield Project
15 17 (0.97%) Cyber Threat
16 15 (0.85%) Data Protection Act
16 15 (0.85%) Public Cloud
17 12 (0.68%) Onboarding
17 12 (0.68%) SCADA
Operating Systems
1 283 (16.10%) Windows
2 266 (15.13%) Linux
3 263 (14.96%) Android
4 14 (0.80%) Windows Server
5 8 (0.46%) zOS
6 7 (0.40%) Windows Vista
7 3 (0.17%) Apple iOS
7 3 (0.17%) Kali Linux
7 3 (0.17%) Windows Server 2012
8 1 (0.057%) AIX
8 1 (0.057%) Red Hat Enterprise Linux
8 1 (0.057%) SUSE
8 1 (0.057%) VMS
Processes & Methodologies
1 566 (32.20%) Project Management
2 389 (22.13%) Problem-Solving
3 373 (21.22%) Cybersecurity
4 334 (19.00%) Line Management
5 332 (18.89%) DevOps
6 321 (18.26%) Information Security
7 311 (17.69%) Stakeholder Management
8 283 (16.10%) Mathematics
9 275 (15.64%) Infrastructure Engineering
10 272 (15.47%) Decision-Making
11 263 (14.96%) Platform Engineering
11 263 (14.96%) Task Automation
12 262 (14.90%) Storage Management
13 246 (13.99%) Agile
14 224 (12.74%) Risk Assessment
15 189 (10.75%) Continuous Improvement
16 184 (10.47%) Balanced Scorecard
16 184 (10.47%) Scorecard
17 171 (9.73%) Coaching
18 154 (8.76%) Security Testing
Programming Languages
1 301 (17.12%) Python
2 286 (16.27%) PowerShell
3 261 (14.85%) Bash
4 50 (2.84%) SQL
5 30 (1.71%) Java
6 12 (0.68%) R
7 8 (0.46%) JavaScript
8 7 (0.40%) C#
9 3 (0.17%) C++
10 2 (0.11%) C
10 2 (0.11%) JCL
10 2 (0.11%) Kusto Query Language
10 2 (0.11%) Ruby
10 2 (0.11%) Scala
10 2 (0.11%) TypeScript
11 1 (0.057%) ABAP
11 1 (0.057%) Bicep
11 1 (0.057%) Data Analysis Expressions
11 1 (0.057%) VBA
Qualifications
1 503 (28.61%) Degree
2 393 (22.35%) BPSS Clearance
3 244 (13.88%) CISSP
4 219 (12.46%) CISM
5 153 (8.70%) CESG Certified Professional
6 94 (5.35%) Security Cleared
7 70 (3.98%) CRISC
8 59 (3.36%) SC Cleared
9 43 (2.45%) Master's Degree
10 41 (2.33%) CISA
11 40 (2.28%) DV Cleared
12 33 (1.88%) Chartered Engineer
13 29 (1.65%) CFA
14 26 (1.48%) Cisco Certification
15 23 (1.31%) HND
16 21 (1.19%) Computer Science Degree
17 19 (1.08%) (ISC)2 CCSP
17 19 (1.08%) APMP
17 19 (1.08%) ISO 27001 Lead Auditor
18 16 (0.91%) CEH
Quality Assurance & Compliance
1 287 (16.33%) ISO/IEC 27001
2 241 (13.71%) NIST
3 155 (8.82%) RMADS
4 152 (8.65%) JSP 440
5 80 (4.55%) GDPR
6 50 (2.84%) ITGC
7 42 (2.39%) Sarbanes-Oxley
8 38 (2.16%) COBIT
9 28 (1.59%) SOC 2
10 27 (1.54%) QA
11 26 (1.48%) GRC
12 25 (1.42%) Cyber Essentials
13 23 (1.31%) California Consumer Privacy Act
13 23 (1.31%) NCSC
14 22 (1.25%) PCI DSS
15 20 (1.14%) Data Quality
16 17 (0.97%) ISO/IEC 27002 (supersedes ISO/IEC 17799)
16 17 (0.97%) PMO
17 12 (0.68%) Cyber Essentials PLUS
18 8 (0.46%) NIST 800
System Software
1 271 (15.42%) Docker
2 268 (15.24%) Hyper-V
3 260 (14.79%) VMware NSX
3 260 (14.79%) vSphere
4 29 (1.65%) Active Directory
5 8 (0.46%) VMware Infrastructure
6 3 (0.17%) Postfix
7 2 (0.11%) Time Sharing Option
8 1 (0.057%) NFS
Systems Management
1 267 (15.19%) Terraform
2 263 (14.96%) Ansible
3 11 (0.63%) Kubernetes
4 8 (0.46%) FortiGate
5 7 (0.40%) Nessus
6 6 (0.34%) Grafana
7 5 (0.28%) Prometheus
8 3 (0.17%) Iperf
8 3 (0.17%) Jamf Pro
8 3 (0.17%) Microsoft Intune
8 3 (0.17%) QRadar
8 3 (0.17%) SCCM
9 2 (0.11%) Host Intrusion Detection System
10 1 (0.057%) cPanel
10 1 (0.057%) EMC NetWorker
10 1 (0.057%) Functional Safety
10 1 (0.057%) Istio
Vendors
1 270 (15.36%) Cisco
2 265 (15.07%) Splunk
3 261 (14.85%) Juniper
4 260 (14.79%) 3PAR
5 115 (6.54%) Microsoft
6 31 (1.76%) SAP
7 30 (1.71%) Bloomberg
8 28 (1.59%) Avaloq
9 23 (1.31%) Salesforce
10 19 (1.08%) Atlassian
11 17 (0.97%) Oracle
12 15 (0.85%) Okta
13 11 (0.63%) IBM
14 10 (0.57%) VMware
15 9 (0.51%) Google
16 8 (0.46%) Fortinet
17 7 (0.40%) ServiceNow
18 6 (0.34%) Databricks
18 6 (0.34%) Tenable
19 5 (0.28%) Autodesk