Splunk Jobs in the UK excluding London

Splunk
UK > UK excluding London

The table below provides summary statistics for permanent job vacancies advertised in the UK excluding London requiring knowledge or experience of Splunk products and/or services. It includes a benchmarking guide to the annual salaries offered in vacancies that cited Splunk over the 6 months leading up to 6 June 2025, comparing them to the same period in the previous two years.

The figures below represent the IT labour market in general and are not representative of salaries within Splunk, Inc.

6 months to
6 Jun 2025
Same period 2024 Same period 2023
Rank 274 402 430
Rank change year-on-year +128 +28 +92
Permanent jobs citing Splunk 400 422 348
As % of all permanent jobs advertised in the UK excluding London 1.00% 0.55% 0.62%
As % of the Vendors category 2.57% 1.64% 1.50%
Number of salaries quoted 65 182 174
10th Percentile £41,700 £41,349 £37,885
25th Percentile £43,750 £45,000 £48,125
Median annual salary (50th Percentile) £57,000 £55,000 £66,250
Median % change year-on-year +3.64% -16.98% +10.42%
75th Percentile £66,250 £67,968 £80,000
90th Percentile £75,000 £80,000 £87,500
UK median annual salary £65,000 £60,000 £70,000
% change year-on-year +8.33% -14.29% -6.67%

All Vendors
UK excluding London

Splunk falls under the Vendor Products and Services category. For comparison with the information above, the following table provides summary statistics for all permanent job vacancies requiring knowledge or experience of all vendor products and services in the UK excluding London.

Permanent vacancies with a requirement for knowledge or experience of vendor products and services 15,586 25,749 23,159
As % of all permanent jobs advertised in the UK excluding London 38.95% 33.31% 41.51%
Number of salaries quoted 8,389 17,354 12,679
10th Percentile £25,087 £25,760 £27,500
25th Percentile £31,250 £32,000 £36,250
Median annual salary (50th Percentile) £47,500 £45,522 £50,000
Median % change year-on-year +4.35% -8.96% +5.26%
75th Percentile £62,500 £60,688 £65,000
90th Percentile £74,407 £74,000 £77,500
UK median annual salary £54,360 £50,000 £57,500
% change year-on-year +8.72% -13.04% +4.55%

Splunk
Job Vacancy Trend in the UK excluding London

Job postings citing Splunk as a proportion of all IT jobs advertised in the UK excluding London.
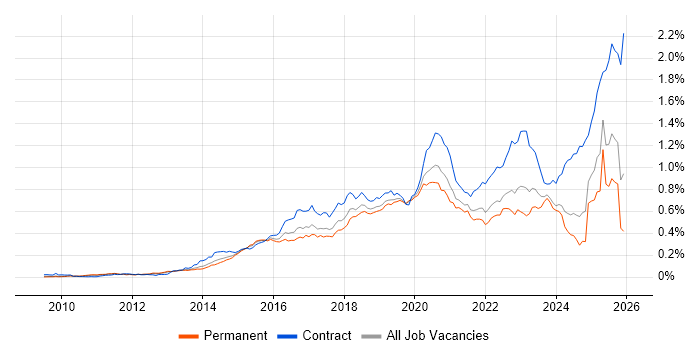
Job vacancy trend for Splunk in the UK excluding London

Splunk
Salary Trend in the UK excluding London

3-month moving average salary quoted in jobs citing Splunk in the UK excluding London.

Salary trend for Splunk in the UK excluding London

Splunk
Salary Histogram in the UK excluding London

Salary distribution for jobs citing Splunk in the UK excluding London over the 6 months to 6 June 2025.

Salary histogram for Splunk in the UK excluding London

Splunk
Job Locations in the UK excluding London

The table below looks at the demand and provides a guide to the median salaries quoted in IT jobs citing Splunk within the UK excluding London region over the 6 months to 6 June 2025. The 'Rank Change' column provides an indication of the change in demand within each location based on the same 6 month period last year.

Location Rank Change
on Same Period
Last Year
Matching
Permanent
IT Job Ads
Median Salary
Past 6 Months
Median Salary
% Change
on Same Period
Last Year
Live
Jobs
North of England +184 275 £55,000 -4.35% 225
North West +165 269 £55,000 -8.33% 106
South East +77 46 £55,000 - 298
Scotland -27 27 £52,500 -34.38% 55
East of England +39 22 £61,500 +2.50% 167
Midlands +70 19 £64,500 +29.00% 179
West Midlands +67 10 £59,000 +18.00% 100
East Midlands +27 9 £72,500 +45.00% 67
South West +104 8 £48,000 -4.00% 125
Yorkshire +28 6 - - 91
Northern Ireland - 2 £55,000 - 20
Isle of Man +13 1 £34,500 -
Splunk
UK

Splunk
Co-occurring Skills and Capabilities in the UK excluding London by Category

The follow tables expand on the table above by listing co-occurrences grouped by category. The same employment type, locality and period is covered with up to 20 co-occurrences shown in each of the following categories:

Application Platforms
1 6 (1.50%) Camunda
1 6 (1.50%) Oracle Workflow
2 3 (0.75%) Confluence
2 3 (0.75%) Microsoft Exchange
2 3 (0.75%) SharePoint
3 1 (0.25%) Apache Airflow
3 1 (0.25%) Apache Spark
3 1 (0.25%) CICS
3 1 (0.25%) JBoss
3 1 (0.25%) WebSphere
Cloud Services
1 59 (14.75%) AWS
2 18 (4.50%) Azure
3 16 (4.00%) Amazon EC2
4 15 (3.75%) GCP
4 15 (3.75%) Serverless
5 13 (3.25%) Amazon ECS
5 13 (3.25%) Amazon EKS
6 6 (1.50%) Azure Sentinel
7 5 (1.25%) Amazon CloudWatch
7 5 (1.25%) AWS CloudFormation
8 4 (1.00%) Datadog
8 4 (1.00%) SaaS
9 3 (0.75%) AWS CodeBuild
9 3 (0.75%) Azure AKS
9 3 (0.75%) Azure Monitor
9 3 (0.75%) BlazeMeter
9 3 (0.75%) GitHub
9 3 (0.75%) Microsoft 365
9 3 (0.75%) Route 53
9 3 (0.75%) Virtual Private Cloud
Communications & Networking
1 282 (70.50%) VPN
2 260 (65.00%) Cisco IOS
3 36 (9.00%) Firewall
4 25 (6.25%) TCP/IP
5 17 (4.25%) Network Security
6 15 (3.75%) HTTP
7 12 (3.00%) FTP
7 12 (3.00%) LAN
7 12 (3.00%) SMTP
7 12 (3.00%) WAN
8 11 (2.75%) Internet
9 5 (1.25%) Intrusion Detection
10 4 (1.00%) DNS
10 4 (1.00%) SAN
11 3 (0.75%) DHCP
11 3 (0.75%) iSCSI
11 3 (0.75%) Remote Desktop
12 2 (0.50%) Reverse Proxy
12 2 (0.50%) SSL
13 1 (0.25%) HTTPS
Database & Business Intelligence
1 25 (6.25%) Relational Database
2 21 (5.25%) PostgreSQL
3 14 (3.50%) RDBMS
4 12 (3.00%) MongoDB
4 12 (3.00%) SQL Server
5 7 (1.75%) NoSQL
6 6 (1.50%) Apache Cassandra
7 5 (1.25%) Elasticsearch
7 5 (1.25%) MySQL
8 3 (0.75%) Data Lake
8 3 (0.75%) Data Warehouse
8 3 (0.75%) DB2
9 2 (0.50%) BigQuery
9 2 (0.50%) Cloud Spanner
9 2 (0.50%) Couchbase
10 1 (0.25%) CockroachDB
10 1 (0.25%) DynamoDB
10 1 (0.25%) Power BI
10 1 (0.25%) Redis
10 1 (0.25%) Tableau
Development Applications
1 25 (6.25%) Jenkins
2 23 (5.75%) JUnit
3 13 (3.25%) JMeter
3 13 (3.25%) Mockito
4 8 (2.00%) Git
4 8 (2.00%) JIRA
5 4 (1.00%) GitLab
6 3 (0.75%) CircleCI
7 1 (0.25%) Cypress.io
7 1 (0.25%) IntelliJ
7 1 (0.25%) Postman
7 1 (0.25%) SoapUI
General
1 290 (72.50%) Analytical Skills
2 287 (71.75%) Inclusion and Diversity
3 34 (8.50%) Social Skills
4 25 (6.25%) Finance
5 22 (5.50%) Law
6 14 (3.50%) Public Sector
7 12 (3.00%) Marketing
8 6 (1.50%) Aerospace
8 6 (1.50%) Aviation
9 5 (1.25%) Banking
10 4 (1.00%) Pharmaceutical
10 4 (1.00%) Telecoms
11 3 (0.75%) Organisational Skills
12 2 (0.50%) Military
12 2 (0.50%) Presentation Skills
13 1 (0.25%) Automotive
13 1 (0.25%) Documentation Skills
13 1 (0.25%) Games
13 1 (0.25%) Legal
13 1 (0.25%) Manufacturing
Job Titles
1 265 (66.25%) Infrastructure Engineer
2 29 (7.25%) Lead
3 28 (7.00%) Developer
4 25 (6.25%) Senior
5 23 (5.75%) Analyst
6 18 (4.50%) SOC Analyst
7 17 (4.25%) Java Developer
7 17 (4.25%) Software Engineer
8 12 (3.00%) Security Engineer
9 11 (2.75%) Senior Analyst
10 8 (2.00%) Cybersecurity Engineer
10 8 (2.00%) Java Engineer
11 7 (1.75%) Site Reliability Engineer
12 6 (1.50%) .NET Developer
12 6 (1.50%) Java Software Engineer
12 6 (1.50%) Security Analyst
12 6 (1.50%) Support Engineer
13 5 (1.25%) Full-Stack Developer
13 5 (1.25%) Full-Stack Java Developer
13 5 (1.25%) SIEM Engineer
Libraries, Frameworks & Software Standards
1 269 (67.25%) Elastic Stack
2 29 (7.25%) Spring
3 28 (7.00%) REST
4 26 (6.50%) Spring Boot
5 18 (4.50%) Web Services
6 14 (3.50%) Hibernate
7 13 (3.25%) ActiveMQ
7 13 (3.25%) Apache Camel
7 13 (3.25%) HTML
7 13 (3.25%) jQuery
7 13 (3.25%) LDAP
7 13 (3.25%) WireMock
8 11 (2.75%) JSON
8 11 (2.75%) Kafka
9 9 (2.25%) .NET
10 7 (1.75%) OpenTelemetry
10 7 (1.75%) XML
11 6 (1.50%) JDBC
11 6 (1.50%) OpenAPI
11 6 (1.50%) Swagger
Miscellaneous
1 260 (65.00%) Cyberattack
2 26 (6.50%) Security Operations Centre
3 14 (3.50%) Distributed Systems
3 14 (3.50%) Management Information System
4 12 (3.00%) Client/Server
5 10 (2.50%) Cyber Threat
6 9 (2.25%) Algorithms
6 9 (2.25%) Cloud Native
7 8 (2.00%) Security Posture
8 6 (1.50%) Robotics
9 5 (1.25%) Cyber Defence
9 5 (1.25%) Product Ownership
10 4 (1.00%) Analytical Mindset
10 4 (1.00%) PKI
11 3 (0.75%) MISP
11 3 (0.75%) Public Cloud
12 2 (0.50%) CMDB
12 2 (0.50%) Legacy Systems
12 2 (0.50%) Private Cloud
12 2 (0.50%) YARA
Operating Systems
1 283 (70.75%) Windows
2 275 (68.75%) Linux
3 266 (66.50%) Android
4 8 (2.00%) Red Hat Enterprise Linux
5 6 (1.50%) Apple iOS
5 6 (1.50%) Ubuntu
6 5 (1.25%) Windows Server
7 3 (0.75%) Debian
7 3 (0.75%) Windows Server 2019
8 2 (0.50%) Windows 10
9 1 (0.25%) Unix
Processes & Methodologies
1 299 (74.75%) Problem-Solving
2 279 (69.75%) DevOps
3 275 (68.75%) Line Management
4 267 (66.75%) Infrastructure Engineering
5 263 (65.75%) Mathematics
5 263 (65.75%) Risk Management
5 263 (65.75%) Task Automation
6 261 (65.25%) Storage Management
7 260 (65.00%) Platform Engineering
8 62 (15.50%) SIEM
9 43 (10.75%) Agile
9 43 (10.75%) CI/CD
9 43 (10.75%) Incident Response
10 37 (9.25%) Cybersecurity
11 31 (7.75%) Security Operations
12 30 (7.50%) Artificial Intelligence
13 28 (7.00%) Software Engineering
14 24 (6.00%) Mentoring
15 23 (5.75%) SDLC
16 21 (5.25%) Machine Learning
Programming Languages
1 305 (76.25%) Python
2 282 (70.50%) Bash
3 277 (69.25%) PowerShell
4 43 (10.75%) Java
5 20 (5.00%) JavaScript
6 16 (4.00%) SQL
7 15 (3.75%) Shell Script
8 9 (2.25%) Perl
9 7 (1.75%) C#
9 7 (1.75%) C++
10 6 (1.50%) Kusto Query Language
11 4 (1.00%) TypeScript
12 3 (0.75%) Go
12 3 (0.75%) Korn
13 2 (0.50%) PL/SQL
13 2 (0.50%) Search Processing Language
14 1 (0.25%) ActionScript
14 1 (0.25%) C
14 1 (0.25%) Ruby
14 1 (0.25%) XPath
Qualifications
1 61 (15.25%) Security Cleared
2 37 (9.25%) SC Cleared
3 33 (8.25%) DV Cleared
4 25 (6.25%) Degree
5 10 (2.50%) CISSP
6 9 (2.25%) Computer Science Degree
7 7 (1.75%) CompTIA Security+
7 7 (1.75%) OSCP
8 6 (1.50%) CEH
9 5 (1.25%) CompTIA CySA+
10 4 (1.00%) Azure Certification
10 4 (1.00%) CISM
10 4 (1.00%) GCIA
11 3 (0.75%) GCIH
12 2 (0.50%) A+ Certification
12 2 (0.50%) CCFP
12 2 (0.50%) EnCE
12 2 (0.50%) GCFA
12 2 (0.50%) GCFE
12 2 (0.50%) GREM
Quality Assurance & Compliance
1 16 (4.00%) ISO/IEC 27001
2 9 (2.25%) NIST
3 8 (2.00%) Cyber Essentials
4 7 (1.75%) SLA
5 6 (1.50%) Cyber Essentials PLUS
5 6 (1.50%) GDPR
6 4 (1.00%) HIPAA
7 1 (0.25%) Accessibility
System Software
1 290 (72.50%) Docker
2 262 (65.50%) vSphere
3 261 (65.25%) Hyper-V
4 260 (65.00%) VMware NSX
5 6 (1.50%) Active Directory
6 3 (0.75%) Citrix Hypervisor
6 3 (0.75%) VMware Infrastructure
7 1 (0.25%) RACF
7 1 (0.25%) Snort
7 1 (0.25%) Virtual Machines
Systems Management
1 275 (68.75%) Terraform
2 267 (66.75%) Ansible
3 36 (9.00%) Kubernetes
4 26 (6.50%) QRadar
5 22 (5.50%) Grafana
6 16 (4.00%) Kibana
7 12 (3.00%) Prometheus
8 6 (1.50%) ArcSight ESM
9 4 (1.00%) Graylog
10 3 (0.75%) ITRS Geneos
10 3 (0.75%) Netcool
10 3 (0.75%) Netcool/OMNIbus
10 3 (0.75%) Tivoli
11 2 (0.50%) Control-M
11 2 (0.50%) EnCase
11 2 (0.50%) FTK
11 2 (0.50%) Progress Chef
11 2 (0.50%) Puppet
11 2 (0.50%) RSA Security Analytics
11 2 (0.50%) SCOM
Vendors
1 267 (66.75%) Cisco
2 262 (65.50%) Juniper
3 260 (65.00%) 3PAR
4 38 (9.50%) Microsoft
5 31 (7.75%) Dynatrace
6 16 (4.00%) Oracle
7 14 (3.50%) ServiceNow
8 10 (2.50%) IBM
9 9 (2.25%) Red Hat
10 8 (2.00%) ArcSight
10 8 (2.00%) Google
10 8 (2.00%) McAfee
11 6 (1.50%) LogLogic
12 5 (1.25%) AppDynamics
12 5 (1.25%) Palo Alto
13 4 (1.00%) AlienVault
13 4 (1.00%) LogRhythm
14 3 (0.75%) Bloomberg
14 3 (0.75%) Moogsoft
14 3 (0.75%) VMware