Resource Allocation Jobs with Hybrid/Remote/WFH Options

Resource Allocation
UK > Work from Home

The table below provides summary statistics for permanent remote or hybrid work requiring Resource Allocation skills. It includes a benchmarking guide to the annual salaries offered in vacancies that cited Resource Allocation over the 6 months leading up to 8 May 2025, comparing them to the same period in the previous two years.

6 months to
8 May 2025
Same period 2024 Same period 2023
Rank 362 450 593
Rank change year-on-year +88 +143 +125
Permanent jobs citing Resource Allocation 65 147 79
As % of all permanent jobs with a WFH option 0.40% 0.44% 0.19%
As % of the Processes & Methodologies category 0.42% 0.48% 0.20%
Number of salaries quoted 35 132 51
10th Percentile £48,500 £40,125 £42,500
25th Percentile £53,125 £46,250 £47,500
Median annual salary (50th Percentile) £60,000 £60,000 £62,325
Median % change year-on-year - -3.73% -4.12%
75th Percentile £80,000 £82,500 £78,125
90th Percentile £105,000 £86,125 £85,000
UK median annual salary £62,500 £60,000 £72,500
% change year-on-year +4.17% -17.24% +11.54%

All Process and Methodology Skills
Work from Home

Resource Allocation falls under the Processes and Methodologies category. For comparison with the information above, the following table provides summary statistics for all permanent job vacancies with remote or hybrid options requiring process or methodology skills.

Permanent vacancies with a requirement for process or methodology skills 15,406 30,912 40,454
As % of all permanent jobs with a WFH option 93.78% 91.49% 96.12%
Number of salaries quoted 9,748 23,470 28,078
10th Percentile £29,750 £33,767 £37,500
25th Percentile £44,000 £42,500 £47,500
Median annual salary (50th Percentile) £60,000 £57,500 £62,500
Median % change year-on-year +4.35% -8.00% +4.17%
75th Percentile £77,500 £75,000 £82,500
90th Percentile £102,500 £95,000 £100,000
UK median annual salary £57,500 £55,000 £61,180
% change year-on-year +4.55% -10.10% +1.97%

Resource Allocation
Trend for Jobs with a WFH Option

Job vacancies with remote working options citing Resource Allocation as a proportion of all IT jobs advertised.
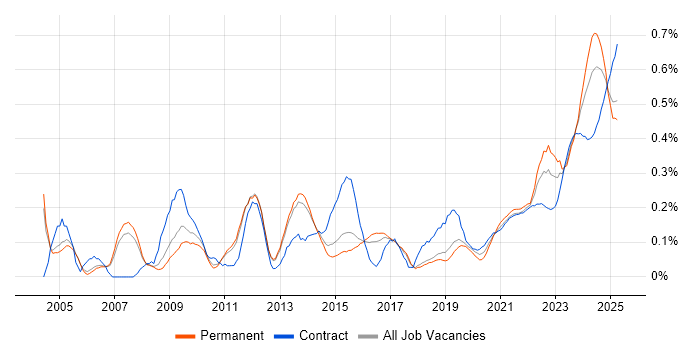
Resource Allocation trend for jobs with Hybrid/Remote/WFH options

Resource Allocation
Salary Trend for Jobs with a WFH Option

3-month moving average salary quoted in job vacancies with remote working options citing Resource Allocation.

Resource Allocation salary trend for jobs with a WFH option

Resource Allocation
Salary Histogram for Jobs with a WFH Option

Salary distribution for jobs with remote working options citing Resource Allocation over the 6 months to 8 May 2025.

Resource Allocation salary histogram for jobs with a WFH option

Resource Allocation
Co-occurring Skills and Capabilities with WFH Options by Category

The follow tables expand on the table above by listing co-occurrences grouped by category. The same employment type, locality and period is covered with up to 20 co-occurrences shown in each of the following categories:

Application Platforms
1 3 (4.62%) Apache
1 3 (4.62%) nginx
1 3 (4.62%) SharePoint
2 1 (1.54%) Apache Spark
Applications
1 8 (12.31%) Microsoft Project
2 4 (6.15%) Microsoft Excel
3 3 (4.62%) Microsoft PowerPoint
4 2 (3.08%) Microsoft Office
5 1 (1.54%) MS Visio
Business Applications
1 2 (3.08%) NetSuite
1 2 (3.08%) SAP Business One
1 2 (3.08%) SAP S/4HANA
2 1 (1.54%) Dynamics CRM
2 1 (1.54%) SAP ERP
Cloud Services
1 11 (16.92%) Azure
2 10 (15.38%) AWS
3 8 (12.31%) GCP
4 6 (9.23%) SaaS
5 5 (7.69%) Snowflake
6 4 (6.15%) Cloud Computing
7 1 (1.54%) Azure DevOps
7 1 (1.54%) Dynamics 365
7 1 (1.54%) Google Analytics
7 1 (1.54%) Power Platform
7 1 (1.54%) SuccessFactors
Communications & Networking
1 3 (4.62%) DNS
1 3 (4.62%) Firewall
2 2 (3.08%) Wireless
Database & Business Intelligence
1 5 (7.69%) Data Lake
1 5 (7.69%) Hadoop
1 5 (7.69%) SAP HANA
2 1 (1.54%) Power BI
Development Applications
1 9 (13.85%) JIRA
General
1 40 (61.54%) Social Skills
2 18 (27.69%) Finance
3 10 (15.38%) Inclusion and Diversity
3 10 (15.38%) Public Sector
4 8 (12.31%) Analytical Skills
4 8 (12.31%) Retail
5 5 (7.69%) Banking
5 5 (7.69%) Law
5 5 (7.69%) Manufacturing
6 4 (6.15%) Aviation
7 2 (3.08%) Financial Institution
7 2 (3.08%) Finnish Language
7 2 (3.08%) Organisational Skills
7 2 (3.08%) Pharmaceutical
7 2 (3.08%) Welsh Language
8 1 (1.54%) Billing
8 1 (1.54%) French Language
8 1 (1.54%) German Language
8 1 (1.54%) Italian Language
8 1 (1.54%) Spanish Language
Job Titles
1 28 (43.08%) Project Manager
2 15 (23.08%) Senior
3 9 (13.85%) Senior Manager
3 9 (13.85%) Senior Project Manager
3 9 (13.85%) Technical Director
4 5 (7.69%) Analyst
4 5 (7.69%) Data Manager
5 4 (6.15%) Associate Project Manager
5 4 (6.15%) IT Manager
6 3 (4.62%) ERP Manager
6 3 (4.62%) Financial Analyst
6 3 (4.62%) Head of Operations
6 3 (4.62%) Infrastructure Engineer
6 3 (4.62%) IT Project Manager
6 3 (4.62%) Senior Infrastructure Engineer
6 3 (4.62%) Testing Analyst
7 2 (3.08%) Infrastructure Manager
7 2 (3.08%) Infrastructure Project Manager
7 2 (3.08%) Programme Director
7 2 (3.08%) Technical Manager
Libraries, Frameworks & Software Standards
1 3 (4.62%) EDI
1 3 (4.62%) Web Services
2 1 (1.54%) .NET
Miscellaneous
1 15 (23.08%) Data Centre
2 9 (13.85%) Renewable Energy
2 9 (13.85%) SCADA
3 6 (9.23%) Management Information System
4 5 (7.69%) Enterprise Software
4 5 (7.69%) Legacy Applications
5 4 (6.15%) Onboarding
6 3 (4.62%) Credit Risk
6 3 (4.62%) Legacy Systems
6 3 (4.62%) Market Risk
6 3 (4.62%) Taxonomies
7 2 (3.08%) NHS
7 2 (3.08%) PMI
7 2 (3.08%) Product Ownership
7 2 (3.08%) Public Cloud
8 1 (1.54%) Analytical Mindset
8 1 (1.54%) Life Science
8 1 (1.54%) Self-Motivation
8 1 (1.54%) Team-Oriented Environment
Operating Systems
1 3 (4.62%) Linux
1 3 (4.62%) Windows
1 3 (4.62%) Windows Server
2 1 (1.54%) VMS
Processes & Methodologies
1 48 (73.85%) Project Management
2 26 (40.00%) PRINCE2
2 26 (40.00%) Project Delivery
3 22 (33.85%) Agile
4 20 (30.77%) Stakeholder Management
5 17 (26.15%) Budgeting and Resource Allocation
6 15 (23.08%) Mentoring
6 15 (23.08%) Problem-Solving
7 12 (18.46%) Stakeholder Engagement
7 12 (18.46%) Waterfall
8 11 (16.92%) Budget Management
8 11 (16.92%) Computer Science
8 11 (16.92%) Continuous Improvement
8 11 (16.92%) Migration
9 10 (15.38%) Analytics
9 10 (15.38%) Budgeting
9 10 (15.38%) Business Strategy
9 10 (15.38%) Data Migration
9 10 (15.38%) Risk Management
9 10 (15.38%) Strategic Planning
Programming Languages
1 1 (1.54%) Python
1 1 (1.54%) SQL
Qualifications
1 31 (47.69%) Degree
2 18 (27.69%) PMI Certification
3 17 (26.15%) PMP
4 7 (10.77%) Computer Science Degree
5 6 (9.23%) Master's Degree
5 6 (9.23%) SAP Certification
6 4 (6.15%) MAPM
6 4 (6.15%) MRICS
7 2 (3.08%) Security Cleared
8 1 (1.54%) ACCA
8 1 (1.54%) Azure Certification
8 1 (1.54%) CIMA
8 1 (1.54%) CISSP
8 1 (1.54%) ISEB
8 1 (1.54%) MBA
8 1 (1.54%) PRINCE2 Practitioner
8 1 (1.54%) SC Cleared
Quality Assurance & Compliance
1 4 (6.15%) PMO
2 3 (4.62%) Data Quality
3 2 (3.08%) GDPR
3 2 (3.08%) QA
4 1 (1.54%) P3O
System Software
1 5 (7.69%) VMware Infrastructure
2 3 (4.62%) Squid
2 3 (4.62%) VMware ESXi
Systems Management
1 3 (4.62%) HAProxy
1 3 (4.62%) Microsoft Intune
Vendors
1 17 (26.15%) Microsoft
2 11 (16.92%) SAP
3 9 (13.85%) Facebook
3 9 (13.85%) YouTube
4 8 (12.31%) Google
5 5 (7.69%) Databricks
5 5 (7.69%) Teradata
5 5 (7.69%) VMware
6 3 (4.62%) HP
6 3 (4.62%) Oracle
6 3 (4.62%) Veeam
7 2 (3.08%) Cisco
7 2 (3.08%) Mitel
8 1 (1.54%) Ariba
8 1 (1.54%) Foundry
8 1 (1.54%) Palantir