Hybrid/Remote Microsoft Project Job Trends

Microsoft Project
UK > Work from Home

The table below provides summary statistics and salary benchmarking for remote or hybrid work requiring Microsoft Project skills. It covers permanent job vacancies from the 6 months leading up to 2 November 2025, with comparisons to the same periods in the previous two years.

6 months to
2 Nov 2025
Same period 2024 Same period 2023
Rank 349 401 369
Rank change year-on-year +52 -32 +42
Permanent jobs citing Microsoft Project 56 64 131
As % of all permanent jobs with remote/hybrid work options 0.34% 0.32% 0.59%
As % of the Applications category 1.80% 4.50% 8.33%
Number of salaries quoted 39 33 99
10th Percentile £37,500 £46,359 £44,800
25th Percentile £43,750 £47,500 £51,104
Median annual salary (50th Percentile) £52,000 £52,500 £57,500
Median % change year-on-year -0.95% -8.70% +15.00%
75th Percentile £77,500 £70,000 £81,250
90th Percentile £79,750 £77,500 £107,500
UK median annual salary £52,500 £55,000 £57,500
% change year-on-year -4.55% -4.35% +4.55%

All Software Application Skills
Work from Home

Microsoft Project falls under the Software Applications category. For comparison with the information above, the following table provides summary statistics for all permanent job vacancies with remote or hybrid options requiring software application skills.

Permanent vacancies with a requirement for software application skills 3,116 1,422 1,573
As % of all permanent jobs with a WFH option 19.17% 7.14% 7.06%
Number of salaries quoted 797 782 1,261
10th Percentile £26,950 £27,050 £28,000
25th Percentile £32,500 £34,750 £36,250
Median annual salary (50th Percentile) £45,000 £47,500 £51,300
Median % change year-on-year -5.26% -7.41% +2.60%
75th Percentile £61,250 £70,000 £65,000
90th Percentile £77,500 £83,750 £80,000
UK median annual salary £40,000 £47,500 £45,000
% change year-on-year -15.79% +5.56% -

Microsoft Project
Job Vacancy Trend for Remote/Hybrid Jobs

Historical trend showing the proportion of permanent IT job postings citing Microsoft Project and offering remote or hybrid work options relative to all permanent IT jobs advertised.
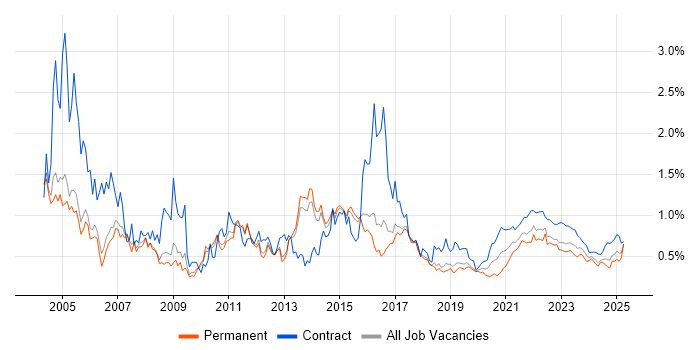
Microsoft Project job vacancy trend for remote/hybrid jobs

Microsoft Project
Salary Trend for Remote/Hybrid Jobs

Salary distribution trend for jobs with remote/hybrid work options citing Microsoft Project.

Salary distribution trend for jobs with remote/hybrid work options citing Microsoft Project

Microsoft Project
Salary Histogram for Remote/Hybrid Jobs

Salary distribution for jobs with remote/hybrid work options citing Microsoft Project over the 6 months to 2 November 2025.

Microsoft Project salary histogram for jobs with remote/hybrid work options

Microsoft Project
Co-Occurring Skills & Capabilities in Remote/Hybrid Jobs by Category

The following tables expand on the one above by listing co-occurrences grouped by category. They cover the same employment type, locality and period, with up to 20 co-occurrences shown in each category:

Application Platforms
1 11 (19.64%) SharePoint
2 4 (7.14%) Confluence
3 1 (1.79%) Microsoft Exchange
Applications
1 15 (26.79%) MS Visio
2 14 (25.00%) Microsoft Excel
3 12 (21.43%) Microsoft Office
4 9 (16.07%) Trello
5 5 (8.93%) Microsoft PowerPoint
Business Applications
1 5 (8.93%) Salesforce CRM
2 4 (7.14%) Primavera
3 3 (5.36%) Dynamics CRM
4 2 (3.57%) Adobe Campaign
4 2 (3.57%) CA PPM
Cloud Services
1 11 (19.64%) Azure
2 8 (14.29%) Azure DevOps
3 6 (10.71%) Smartsheet
4 5 (8.93%) Microsoft 365
5 4 (7.14%) Power Platform
6 3 (5.36%) Dynamics 365
7 2 (3.57%) Asana
8 1 (1.79%) Power Automate
8 1 (1.79%) SaaS
Database & Business Intelligence
1 4 (7.14%) Power BI
2 1 (1.79%) Power Query
2 1 (1.79%) SQL Server
Development Applications
1 17 (30.36%) JIRA
General
1 31 (55.36%) Social Skills
2 16 (28.57%) Finance
3 12 (21.43%) Retail
4 8 (14.29%) Analytical Skills
4 8 (14.29%) Inclusion and Diversity
4 8 (14.29%) Public Sector
5 6 (10.71%) Law
6 5 (8.93%) Telecoms
7 4 (7.14%) Legal
7 4 (7.14%) Marketing
7 4 (7.14%) Presentation Skills
8 3 (5.36%) Documentation Skills
8 3 (5.36%) Manufacturing
8 3 (5.36%) Organisational Skills
8 3 (5.36%) Pharmaceutical
9 2 (3.57%) Advertising
9 2 (3.57%) Influencing Skills
9 2 (3.57%) Public Speaking
10 1 (1.79%) Aerospace
10 1 (1.79%) Back Office
Job Titles
1 20 (35.71%) Project Manager
2 9 (16.07%) IT Manager
3 8 (14.29%) Delivery Manager
4 5 (8.93%) Senior
4 5 (8.93%) Senior Manager
4 5 (8.93%) Support Engineer
5 4 (7.14%) Analyst
5 4 (7.14%) IT Project Manager
5 4 (7.14%) Project Engineer
5 4 (7.14%) Project Support Engineer
5 4 (7.14%) Senior Project Manager
5 4 (7.14%) Technical Engineer
5 4 (7.14%) Technical Support
5 4 (7.14%) Technical Support Engineer
6 3 (5.36%) Project Delivery Manager
7 2 (3.57%) Commercial Project Manager
7 2 (3.57%) Healthcare Manager
7 2 (3.57%) Healthcare Project Manager
7 2 (3.57%) Programme Planner
7 2 (3.57%) Project Coordinator
Libraries, Frameworks & Software Standards
1 1 (1.79%) ADO
Miscellaneous
1 6 (10.71%) PMI
1 6 (10.71%) Social Media
2 5 (8.93%) Management Information System
2 5 (8.93%) NHS
3 4 (7.14%) Driving Licence
3 4 (7.14%) Robotics
4 2 (3.57%) FMCG
4 2 (3.57%) Marketing Technology
4 2 (3.57%) Product Ownership
5 1 (1.79%) Analytical Mindset
5 1 (1.79%) Legacy Systems
5 1 (1.79%) Onboarding
5 1 (1.79%) Operational Technology
5 1 (1.79%) Public Cloud
5 1 (1.79%) Self-Motivation
Operating Systems
1 7 (12.50%) Windows
2 1 (1.79%) Windows Server
Processes & Methodologies
1 45 (80.36%) Project Management
2 34 (60.71%) PRINCE2
3 31 (55.36%) Agile
4 26 (46.43%) Project Delivery
5 19 (33.93%) Waterfall
6 18 (32.14%) Stakeholder Management
7 16 (28.57%) Change Management
8 15 (26.79%) Business Case
9 14 (25.00%) Stakeholder Engagement
10 12 (21.43%) Continuous Improvement
10 12 (21.43%) CRM
11 11 (19.64%) Project Governance
12 10 (17.86%) Problem-Solving
13 9 (16.07%) Budget Management
13 9 (16.07%) DevOps
13 9 (16.07%) Project Planning
13 9 (16.07%) Resource Management
14 8 (14.29%) Process Improvement
14 8 (14.29%) Scrum
15 7 (12.50%) Collaborative Working
Programming Languages
1 1 (1.79%) Data Analysis Expressions
1 1 (1.79%) SQL
Qualifications
1 42 (75.00%) Degree
2 19 (33.93%) PMI Certification
3 15 (26.79%) PMP
4 6 (10.71%) DBS Check
5 5 (8.93%) PRINCE2 Practitioner
6 3 (5.36%) SC Cleared
6 3 (5.36%) Security Cleared
7 1 (1.79%) APMP
7 1 (1.79%) CBAP
7 1 (1.79%) CISM
7 1 (1.79%) CISSP
7 1 (1.79%) CRISC
7 1 (1.79%) ITIL Certification
7 1 (1.79%) Master's Degree
7 1 (1.79%) SAFe Agilist
Quality Assurance & Compliance
1 18 (32.14%) PMO
2 12 (21.43%) QA
3 3 (5.36%) P3O
4 1 (1.79%) Accessibility
System Software
1 2 (3.57%) Active Directory
Vendors
1 24 (42.86%) Microsoft
2 5 (8.93%) Salesforce
2 5 (8.93%) SAP
3 2 (3.57%) Adobe
3 2 (3.57%) Marketo
3 2 (3.57%) Pegasus
3 2 (3.57%) Planview
3 2 (3.57%) ServiceNow
4 1 (1.79%) Apple
4 1 (1.79%) NEC
4 1 (1.79%) Oracle