Waterfall Jobs with Hybrid/Remote/WFH Options

Waterfall Model
UK > Work from Home

The table below provides summary statistics for permanent remote or hybrid work requiring Waterfall skills. It includes a benchmarking guide to the annual salaries offered in vacancies that cited Waterfall over the 6 months leading up to 3 May 2025, comparing them to the same period in the previous two years.

6 months to
3 May 2025
Same period 2024 Same period 2023
Rank 254 248 144
Rank change year-on-year -6 -104 +32
Permanent jobs citing Waterfall 170 417 1,008
As % of all permanent jobs with a WFH option 1.12% 1.23% 2.37%
As % of the Processes & Methodologies category 1.20% 1.35% 2.46%
Number of salaries quoted 123 343 756
10th Percentile £43,542 £37,500 £42,500
25th Percentile £50,625 £46,250 £50,000
Median annual salary (50th Percentile) £59,500 £54,000 £59,526
Median % change year-on-year +10.19% -9.28% +3.52%
75th Percentile £69,000 £67,500 £75,000
90th Percentile £93,500 £83,750 £83,750
UK median annual salary £60,000 £55,000 £60,000
% change year-on-year +9.09% -8.33% +4.35%

All Process and Methodology Skills
Work from Home

Waterfall falls under the Processes and Methodologies category. For comparison with the information above, the following table provides summary statistics for all permanent job vacancies with remote or hybrid options requiring process or methodology skills.

Permanent vacancies with a requirement for process or methodology skills 14,134 30,993 40,912
As % of all permanent jobs with a WFH option 93.17% 91.62% 96.10%
Number of salaries quoted 9,780 23,560 28,419
10th Percentile £30,000 £33,750 £37,500
25th Percentile £45,000 £42,500 £47,500
Median annual salary (50th Percentile) £60,000 £57,500 £62,500
Median % change year-on-year +4.35% -8.00% +4.17%
75th Percentile £77,500 £75,000 £82,500
90th Percentile £102,500 £95,000 £100,000
UK median annual salary £57,500 £55,000 £61,500
% change year-on-year +4.55% -10.57% +2.50%

Waterfall
Trend for Jobs with a WFH Option

Job vacancies with remote working options citing Waterfall as a proportion of all IT jobs advertised.
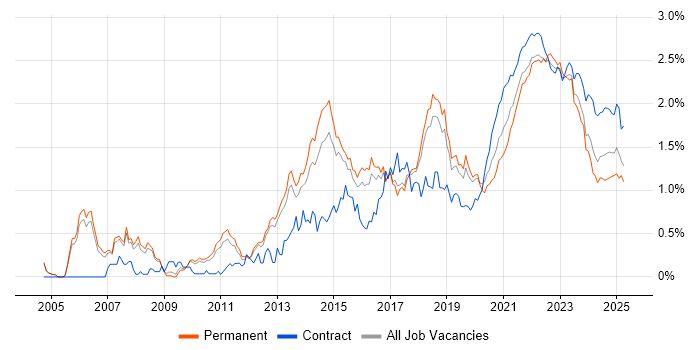
Waterfall trend for jobs with Hybrid/Remote/WFH options

Waterfall
Salary Trend for Jobs with a WFH Option

3-month moving average salary quoted in job vacancies with remote working options citing Waterfall.

Waterfall salary trend for jobs with a WFH option

Waterfall
Salary Histogram for Jobs with a WFH Option

Salary distribution for jobs with remote working options citing Waterfall over the 6 months to 3 May 2025.

Waterfall salary histogram for jobs with a WFH option

Waterfall
Co-occurring Skills and Capabilities with WFH Options by Category

The follow tables expand on the table above by listing co-occurrences grouped by category. The same employment type, locality and period is covered with up to 20 co-occurrences shown in each of the following categories:

Application Platforms
1 6 (3.53%) Apache Spark
1 6 (3.53%) Confluence
1 6 (3.53%) SharePoint
2 4 (2.35%) Apache
3 3 (1.76%) CMS
3 3 (1.76%) Umbraco
4 2 (1.18%) Apache Airflow
5 1 (0.59%) CICS
5 1 (0.59%) ColdFusion
5 1 (0.59%) OpenEdge
Applications
1 21 (12.35%) Microsoft Project
2 15 (8.82%) Microsoft Office
3 10 (5.88%) Microsoft Excel
4 9 (5.29%) MS Visio
5 8 (4.71%) Trello
6 6 (3.53%) Microsoft PowerPoint
7 1 (0.59%) Spreadsheet
Business Applications
1 6 (3.53%) Dynamics CRM
2 3 (1.76%) SAP S/4HANA
3 2 (1.18%) Adobe Campaign
3 2 (1.18%) Salesforce CRM
4 1 (0.59%) Elite 3E
4 1 (0.59%) Oracle EBS
4 1 (0.59%) Oracle EBS R12
4 1 (0.59%) Oracle ERP
4 1 (0.59%) SAP ERP
Cloud Services
1 29 (17.06%) Azure
2 22 (12.94%) AWS
3 16 (9.41%) Power Platform
4 13 (7.65%) Azure DevOps
4 13 (7.65%) Dynamics 365
5 12 (7.06%) Microsoft 365
5 12 (7.06%) SaaS
6 11 (6.47%) Amazon S3
7 8 (4.71%) GitHub
7 8 (4.71%) Power Automate
8 7 (4.12%) Amazon CloudWatch
8 7 (4.12%) Amazon EC2
8 7 (4.12%) GCP
8 7 (4.12%) Virtual Private Cloud
9 6 (3.53%) PowerApps
10 5 (2.94%) Microsoft Copilot
10 5 (2.94%) Smartsheet
11 4 (2.35%) AWS Lambda
11 4 (2.35%) Serverless
11 4 (2.35%) Slack
Communications & Networking
1 2 (1.18%) Firewall
2 1 (0.59%) Broadband
2 1 (0.59%) DNS
2 1 (0.59%) LoRaWAN
2 1 (0.59%) SD-WAN
2 1 (0.59%) VPN
2 1 (0.59%) WAN
Database & Business Intelligence
1 13 (7.65%) SQL Server
2 10 (5.88%) Data Warehouse
2 10 (5.88%) Power BI
3 9 (5.29%) Relational Database
3 9 (5.29%) Tableau
4 7 (4.12%) PostgreSQL
4 7 (4.12%) SQL Server Integration Services
5 4 (2.35%) Amazon Redshift
5 4 (2.35%) RDBMS
6 3 (1.76%) Data Lake
6 3 (1.76%) MySQL
6 3 (1.76%) SQL Server Reporting Services
7 2 (1.18%) Apache Hive
7 2 (1.18%) Azure SQL Database
7 2 (1.18%) Big Data
7 2 (1.18%) OLTP
7 2 (1.18%) Oracle Database
7 2 (1.18%) SQL Server Analysis Services
8 1 (0.59%) Oracle Reports
8 1 (0.59%) SAP HANA
Development Applications
1 20 (11.76%) JIRA
2 4 (2.35%) Cypress.io
3 3 (1.76%) Git
3 3 (1.76%) Selenium
4 1 (0.59%) Babel
4 1 (0.59%) IBM UrbanCode
4 1 (0.59%) Jenkins
4 1 (0.59%) Oracle APEX
4 1 (0.59%) Oracle Forms
4 1 (0.59%) Subversion
4 1 (0.59%) Team Foundation Server
4 1 (0.59%) webpack
General
1 84 (49.41%) Social Skills
2 51 (30.00%) Finance
3 37 (21.76%) Analytical Skills
4 13 (7.65%) Law
5 9 (5.29%) Inclusion and Diversity
6 7 (4.12%) Banking
6 7 (4.12%) Manufacturing
6 7 (4.12%) Organisational Skills
7 6 (3.53%) Marketing
7 6 (3.53%) Presentation Skills
8 5 (2.94%) Influencing Skills
8 5 (2.94%) Legal
8 5 (2.94%) Public Sector
9 3 (1.76%) Military
9 3 (1.76%) Retail
10 2 (1.18%) Front Office
10 2 (1.18%) Tech for Good
11 1 (0.59%) Aviation
11 1 (0.59%) Back Office
11 1 (0.59%) Electronics
Job Titles
1 49 (28.82%) Project Manager
2 37 (21.76%) Senior
3 28 (16.47%) Analyst
4 24 (14.12%) Business Analyst
5 14 (8.24%) Architect
6 13 (7.65%) IT Manager
6 13 (7.65%) IT Project Manager
7 11 (6.47%) Developer
8 9 (5.29%) Senior Analyst
9 8 (4.71%) Data Engineer
9 8 (4.71%) Development Manager
9 8 (4.71%) Solutions Architect
10 7 (4.12%) Azure Architect
10 7 (4.12%) Consultant
10 7 (4.12%) Digital Project Manager
10 7 (4.12%) Java Development Manager
10 7 (4.12%) Senior Data Engineer
10 7 (4.12%) Systems Manager
11 6 (3.53%) Senior Business Analyst
11 6 (3.53%) Senior Solutions Architect
Libraries, Frameworks & Software Standards
1 10 (5.88%) .NET
2 9 (5.29%) React
3 8 (4.71%) HTML
4 4 (2.35%) CSS
4 4 (2.35%) Playwright
5 3 (1.76%) .NET Core
5 3 (1.76%) ASP.NET
5 3 (1.76%) JSON
5 3 (1.76%) SOAP
6 2 (1.18%) .NET Framework
6 2 (1.18%) ADO
6 2 (1.18%) AngularJS
6 2 (1.18%) ASP.NET Web API
6 2 (1.18%) ASP.NET Web Forms
6 2 (1.18%) jQuery
6 2 (1.18%) Kafka
6 2 (1.18%) REST
6 2 (1.18%) RESTful
6 2 (1.18%) Web Services
7 1 (0.59%) XML
Miscellaneous
1 18 (10.59%) Product Ownership
2 10 (5.88%) Management Information System
3 6 (3.53%) PMI
4 4 (2.35%) Legacy Applications
5 3 (1.76%) Cloud Native
5 3 (1.76%) Legacy Systems
5 3 (1.76%) Low-Code
5 3 (1.76%) NHS
5 3 (1.76%) Virtual Team
6 2 (1.18%) Analytical Mindset
6 2 (1.18%) Client/Server
6 2 (1.18%) Cyberattack
6 2 (1.18%) Data Centre
6 2 (1.18%) Data Protection Act
6 2 (1.18%) Greenfield Project
6 2 (1.18%) IoT
6 2 (1.18%) Market Risk
6 2 (1.18%) Marketing Technology
6 2 (1.18%) Mobile App
6 2 (1.18%) Social Media
Operating Systems
1 4 (2.35%) Windows
2 2 (1.18%) Linux
2 2 (1.18%) Windows Vista
3 1 (0.59%) AIX
3 1 (0.59%) Android
3 1 (0.59%) Apple iOS
3 1 (0.59%) CentOS
3 1 (0.59%) Debian
3 1 (0.59%) Unix
3 1 (0.59%) zOS
Processes & Methodologies
1 163 (95.88%) Agile
2 81 (47.65%) Project Management
3 60 (35.29%) Project Delivery
4 53 (31.18%) Scrum
5 46 (27.06%) Stakeholder Management
6 32 (18.82%) Problem-Solving
6 32 (18.82%) Roadmaps
7 31 (18.24%) Business Case
8 28 (16.47%) Change Management
8 28 (16.47%) Decision-Making
9 27 (15.88%) Analytics
9 27 (15.88%) Continuous Improvement
9 27 (15.88%) PRINCE2
10 24 (14.12%) DevOps
11 20 (11.76%) Project Planning
12 19 (11.18%) Business Analysis
12 19 (11.18%) Process Improvement
12 19 (11.18%) Stakeholder Engagement
13 18 (10.59%) Software Engineering
14 16 (9.41%) Business Intelligence
Programming Languages
1 27 (15.88%) SQL
2 19 (11.18%) Java
3 17 (10.00%) JavaScript
4 15 (8.82%) Python
5 13 (7.65%) C#
6 8 (4.71%) T-SQL
7 4 (2.35%) VBA
8 3 (1.76%) PowerShell
9 1 (0.59%) Ada
9 1 (0.59%) Bicep
9 1 (0.59%) C++
9 1 (0.59%) JCL
9 1 (0.59%) PHP
9 1 (0.59%) PL/SQL
9 1 (0.59%) TypeScript
9 1 (0.59%) VB.NET
Qualifications
1 28 (16.47%) Degree
2 18 (10.59%) PMI Certification
3 16 (9.41%) PMP
4 9 (5.29%) Security Cleared
5 6 (3.53%) DBS Check
5 6 (3.53%) SC Cleared
6 5 (2.94%) Azure Certification
7 4 (2.35%) Microsoft Certification
8 3 (1.76%) Computer Science Degree
8 3 (1.76%) CSPO
8 3 (1.76%) Master's Degree
9 2 (1.18%) SAP Certification
10 1 (0.59%) CISA
10 1 (0.59%) Cisco Certification
10 1 (0.59%) CISM
10 1 (0.59%) CISSP
10 1 (0.59%) ISEB
10 1 (0.59%) ISTQB
10 1 (0.59%) MBA
10 1 (0.59%) MCSD
Quality Assurance & Compliance
1 30 (17.65%) QA
2 15 (8.82%) Data Quality
3 8 (4.71%) PMO
4 2 (1.18%) Accessibility
4 2 (1.18%) NCSC
5 1 (0.59%) Cyber Essentials
5 1 (0.59%) GDPR
5 1 (0.59%) ISO/IEC 27001
5 1 (0.59%) NIST
5 1 (0.59%) P3O
5 1 (0.59%) PCI DSS
System Software
1 1 (0.59%) Virtual Machines
Systems Management
1 1 (0.59%) CA Service Virtualization
1 1 (0.59%) Single Sign-On
1 1 (0.59%) Terraform
Vendors
1 49 (28.82%) Microsoft
2 13 (7.65%) Google
3 11 (6.47%) Oracle
4 9 (5.29%) Salesforce
5 8 (4.71%) SAP
6 7 (4.12%) Cisco
7 6 (3.53%) IBM
8 4 (2.35%) Blue Prism
8 4 (2.35%) UiPath
9 3 (1.76%) Databricks
10 2 (1.18%) Adobe
10 2 (1.18%) Marketo
10 2 (1.18%) TippingPoint
11 1 (0.59%) Ariba
11 1 (0.59%) Arqiva
11 1 (0.59%) F5
11 1 (0.59%) Guidewire
11 1 (0.59%) Meraki
11 1 (0.59%) Red Hat
11 1 (0.59%) ServiceNow