CRM Contracts in London

Customer Relationship Management (CRM)
England > London

The table below provides summary statistics for contract job vacancies advertised in London requiring CRM skills. It includes a benchmarking guide to the contractor rates offered in vacancies that cited CRM over the 6 months leading up to 15 August 2025, comparing them to the same period in the previous two years.

6 months to
15 Aug 2025
Same period 2024 Same period 2023
Rank 106 128 138
Rank change year-on-year +22 +10 +9
Contract jobs citing CRM 366 328 437
As % of all contract jobs advertised in London 2.71% 2.03% 1.86%
As % of the Processes & Methodologies category 2.93% 2.28% 2.05%
Number of daily rates quoted 233 215 312
10th Percentile £257 £313 £363
25th Percentile £396 £416 £446
Median daily rate (50th Percentile) £500 £513 £531
Median % change year-on-year -2.44% -3.53% -3.41%
75th Percentile £613 £625 £645
90th Percentile £688 £679 £936
England median daily rate £490 £500 £525
% change year-on-year -2.00% -4.76% -0.57%
Number of hourly rates quoted 11 5 10
10th Percentile £16.50 £26.90 £16.49
25th Percentile £24.95 £27.50 £22.31
Median hourly rate £34.65 £35.00 £26.50
Median % change year-on-year -1.00% +32.08% +27.50%
75th Percentile £42.13 £137.50 £28.44
90th Percentile £47.50 - £36.38
England median hourly rate £18.75 £27.75 £20.57
% change year-on-year -32.43% +34.94% +24.64%

All Process and Methodology Skills
London

CRM falls under the Processes and Methodologies category. For comparison with the information above, the following table provides summary statistics for all contract job vacancies requiring process or methodology skills in London.

Contract vacancies with a requirement for process or methodology skills 12,480 14,379 21,308
As % of all contract IT jobs advertised in London 92.33% 88.83% 90.63%
Number of daily rates quoted 8,317 10,066 15,500
10th Percentile £325 £350 £363
25th Percentile £425 £450 £463
Median daily rate (50th Percentile) £540 £550 £575
Median % change year-on-year -1.82% -4.35% -
75th Percentile £675 £688 £700
90th Percentile £775 £800 £800
England median daily rate £513 £525 £550
% change year-on-year -2.38% -4.55% -
Number of hourly rates quoted 250 197 226
10th Percentile £16.50 £16.99 £18.00
25th Percentile £24.66 £22.00 £23.12
Median hourly rate £29.50 £35.00 £40.00
Median % change year-on-year -15.71% -12.50% +8.11%
75th Percentile £49.31 £53.75 £64.88
90th Percentile £63.75 £71.50 £81.13
England median hourly rate £25.15 £43.00 £41.50
% change year-on-year -41.51% +3.61% +56.60%

CRM
Job Vacancy Trend in London

Job postings citing CRM as a proportion of all IT jobs advertised in London.
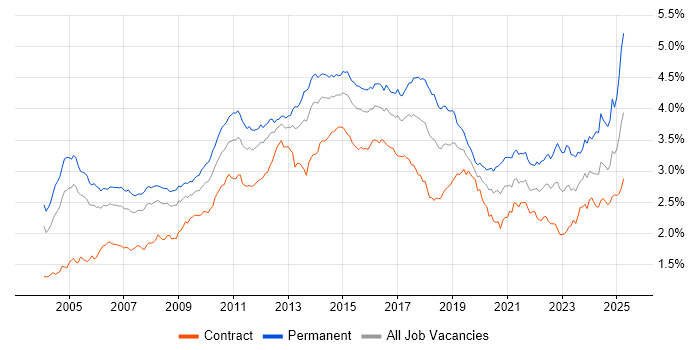
Job vacancy trend for CRM in London

CRM
Contractor Daily Rate Trend in London

3-month moving average daily rate quoted in jobs citing CRM in London.

Daily rate trend for CRM in London

CRM
Daily Rate Histogram in London

Daily rate distribution for jobs citing CRM in London over the 6 months to 15 August 2025.

Daily rate histogram for CRM in London

CRM
Contractor Hourly Rate Trend in London

3-month moving average hourly rates quoted in jobs citing CRM in London.

Hourly rate trend for CRM in London

CRM
Hourly Rate Histogram in London

Hourly rate distribution of jobs citing CRM in London over the 6 months to 15 August 2025.

Hourly rate histogram for CRM in London

CRM
Contract Job Locations in London

The table below looks at the demand and provides a guide to the median contractor rates quoted in IT jobs citing CRM within the London region over the 6 months to 15 August 2025. The 'Rank Change' column provides an indication of the change in demand within each location based on the same 6 month period last year.

Location Rank Change
on Same Period
Last Year
Matching
Contract
IT Job Ads
Median
Daily Rate
Past 6 Months
Median Daily Rate
% Change
on Same Period
Last Year
Live
Jobs
Central London +11 68 £469 -14.77% 106
West London +3 9 £525 -25.00% 30
South London -4 3 £525 +38.16% 14
North London - 1 £350 -
CRM
England

CRM
Co-occurring Skills and Capabilities in London by Category

The follow tables expand on the table above by listing co-occurrences grouped by category. The same employment type, locality and period is covered with up to 20 co-occurrences shown in each of the following categories:

Application Platforms
1 18 (4.92%) SharePoint
2 16 (4.37%) CMS
3 9 (2.46%) Confluence
4 5 (1.37%) Microsoft Exchange
5 2 (0.55%) Headless CMS
5 2 (0.55%) Moodle
6 1 (0.27%) Alfresco
6 1 (0.27%) Apache Solr
6 1 (0.27%) Drupal
6 1 (0.27%) WordPress
Applications
1 24 (6.56%) Microsoft Excel
2 13 (3.55%) Microsoft Office
3 7 (1.91%) Microsoft PowerPoint
4 5 (1.37%) Chatbot
5 4 (1.09%) Adobe Illustrator
5 4 (1.09%) Microsoft Project
5 4 (1.09%) Photoshop
6 3 (0.82%) InVision
6 3 (0.82%) MS Visio
6 3 (0.82%) OmniGraffle
6 3 (0.82%) Sketch
6 3 (0.82%) UXPin
7 1 (0.27%) Adobe After Effects
7 1 (0.27%) Spreadsheet
7 1 (0.27%) SPSS
Business Applications
1 135 (36.89%) Dynamics CRM
2 26 (7.10%) Salesforce CRM
3 10 (2.73%) SAP S/4HANA
4 6 (1.64%) Workday HCM
5 4 (1.09%) Shopify
6 3 (0.82%) NetSuite
6 3 (0.82%) SAP CRM
6 3 (0.82%) SAP CX
6 3 (0.82%) Workfront
7 2 (0.55%) Dynamics AX
7 2 (0.55%) Magento
7 2 (0.55%) Oracle Retail
8 1 (0.27%) Bloomberg TOMS
8 1 (0.27%) Dynamics GP
8 1 (0.27%) Dynamics NAV
8 1 (0.27%) FastStats
8 1 (0.27%) Oracle ERP
8 1 (0.27%) Payment Gateway
8 1 (0.27%) Raiser’s Edge
8 1 (0.27%) SAP SM
Cloud Services
1 92 (25.14%) Dynamics 365
2 75 (20.49%) Power Platform
3 70 (19.13%) Azure
4 41 (11.20%) Power Automate
5 32 (8.74%) PowerApps
6 23 (6.28%) Azure DevOps
7 20 (5.46%) AWS
8 18 (4.92%) SaaS
9 14 (3.83%) Salesforce Sales Cloud
10 13 (3.55%) Azure Logic Apps
11 12 (3.28%) GCP
12 11 (3.01%) PaaS
13 10 (2.73%) Serverless
14 9 (2.46%) Microsoft 365
15 7 (1.91%) Azure Data Factory
15 7 (1.91%) Azure Service Bus
15 7 (1.91%) Entra ID
16 6 (1.64%) Azure Functions
16 6 (1.64%) Figma
16 6 (1.64%) Snowflake
Communications & Networking
1 6 (1.64%) Firewall
2 5 (1.37%) VPN
3 3 (0.82%) LAN
4 2 (0.55%) 4G
4 2 (0.55%) 5G
4 2 (0.55%) Unified Communications
4 2 (0.55%) VoLTE
4 2 (0.55%) VoWiFi
5 1 (0.27%) DHCP
5 1 (0.27%) DNS
5 1 (0.27%) Internet
5 1 (0.27%) Intranet
5 1 (0.27%) IP Telephony
5 1 (0.27%) MPLS
5 1 (0.27%) Radio Access Network
5 1 (0.27%) SMS
5 1 (0.27%) TCP/IP
5 1 (0.27%) WAN
5 1 (0.27%) WebEx
Database & Business Intelligence
1 38 (10.38%) Power BI
2 15 (4.10%) SQL Server
3 12 (3.28%) SQL Server Integration Services
3 12 (3.28%) SQL Server Reporting Services
4 10 (2.73%) Tableau
5 9 (2.46%) Metadata
6 8 (2.19%) Relational Database
7 7 (1.91%) Data Warehouse
8 6 (1.64%) BigQuery
9 5 (1.37%) Data Lake
9 5 (1.37%) NoSQL
10 4 (1.09%) Amazon Redshift
10 4 (1.09%) PostgreSQL
11 2 (0.55%) Amazon RDS
11 2 (0.55%) SAP BW
11 2 (0.55%) SAP Data Services
11 2 (0.55%) SAP HANA
12 1 (0.27%) MongoDB
12 1 (0.27%) PowerPivot
12 1 (0.27%) SQL Server Analysis Services
Development Applications
1 33 (9.02%) JIRA
2 5 (1.37%) Postman
3 4 (1.09%) Git
4 3 (0.82%) Axure RP
4 3 (0.82%) Balsamiq
4 3 (0.82%) CircleCI
4 3 (0.82%) ER Studio
4 3 (0.82%) ERwin
5 2 (0.55%) Eclipse
5 2 (0.55%) GitLab
5 2 (0.55%) Jenkins
5 2 (0.55%) Selenium
5 2 (0.55%) Visual Studio Team System
6 1 (0.27%) PowerDesigner
6 1 (0.27%) Visual Studio
6 1 (0.27%) Zephyr
General
1 136 (37.16%) Social Skills
2 97 (26.50%) Finance
3 93 (25.41%) Marketing
4 47 (12.84%) Analytical Skills
5 26 (7.10%) Public Sector
6 24 (6.56%) Banking
7 21 (5.74%) Retail
8 20 (5.46%) Billing
9 15 (4.10%) Advertising
10 14 (3.83%) Inclusion and Diversity
11 11 (3.01%) Presentation Skills
12 8 (2.19%) Back Office
12 8 (2.19%) Documentation Skills
12 8 (2.19%) Local Government
12 8 (2.19%) Telecoms
13 7 (1.91%) Organisational Skills
14 4 (1.09%) Automotive
14 4 (1.09%) Legal
14 4 (1.09%) Pharmaceutical
15 3 (0.82%) Multimedia
Job Titles
1 60 (16.39%) Analyst
2 45 (12.30%) Architect
3 40 (10.93%) Developer
4 34 (9.29%) Business Analyst
5 33 (9.02%) Senior
6 30 (8.20%) Consultant
7 25 (6.83%) Lead
8 23 (6.28%) Project Manager
8 23 (6.28%) Solutions Architect
9 17 (4.64%) CRM Analyst
9 17 (4.64%) Dynamics 365 Developer
10 16 (4.37%) Dynamics 365 Consultant
11 15 (4.10%) CRM Business Analyst
11 15 (4.10%) CRM Developer
12 13 (3.55%) Data Analyst
12 13 (3.55%) Functional Consultant
13 12 (3.28%) CRM Manager
14 11 (3.01%) Dynamics 365 Analyst
15 10 (2.73%) Salesforce Analyst
16 9 (2.46%) CRM Consultant
Libraries, Frameworks & Software Standards
1 27 (7.38%) .NET
2 23 (6.28%) Web Services
3 19 (5.19%) REST
4 17 (4.64%) Lightning Web Components
5 15 (4.10%) SOAP
6 14 (3.83%) HTML
7 11 (3.01%) ASP.NET Web API
8 9 (2.46%) ASP.NET
8 9 (2.46%) CSS
8 9 (2.46%) RESTful
9 8 (2.19%) .NET Framework
10 7 (1.91%) .NET Core
10 7 (1.91%) Middleware
11 6 (1.64%) ADO
11 6 (1.64%) ASP.NET MVC
11 6 (1.64%) JSON
11 6 (1.64%) Visualforce
11 6 (1.64%) WCF
12 5 (1.37%) Entity Framework
12 5 (1.37%) StructureMap
Miscellaneous
1 24 (6.56%) Product Ownership
2 17 (4.64%) Onboarding
3 13 (3.55%) Management Information System
4 12 (3.28%) Legacy Systems
5 10 (2.73%) Data Structures
5 10 (2.73%) Enterprise Software
6 9 (2.46%) Low-Code
6 9 (2.46%) Marketing Technology
7 6 (1.64%) Social Media
8 5 (1.37%) Analytical Mindset
8 5 (1.37%) Cloud Native
8 5 (1.37%) Greenfield Project
8 5 (1.37%) Linux Command Line
8 5 (1.37%) Mobile App
8 5 (1.37%) N-Tier
9 4 (1.09%) Self-Motivation
10 3 (0.82%) AI Agents
10 3 (0.82%) Hybrid Cloud
10 3 (0.82%) Reinsurance
10 3 (0.82%) Virtual Team
Operating Systems
1 5 (1.37%) Linux
2 3 (0.82%) Android
2 3 (0.82%) Apple iOS
3 2 (0.55%) Windows
3 2 (0.55%) Windows 10
4 1 (0.27%) Mac OS X
4 1 (0.27%) Windows 7
Processes & Methodologies
1 101 (27.60%) Agile
2 65 (17.76%) Migration
3 62 (16.94%) Stakeholder Management
4 57 (15.57%) Problem-Solving
5 49 (13.39%) Business Intelligence
6 47 (12.84%) Project Management
7 46 (12.57%) Data Migration
8 43 (11.75%) Roadmaps
9 42 (11.48%) Stakeholder Engagement
10 40 (10.93%) DevOps
11 39 (10.66%) Analytics
11 39 (10.66%) ERP
12 36 (9.84%) Data Analysis
13 33 (9.02%) Customer Service
13 33 (9.02%) User Experience
14 28 (7.65%) Customer Engagement
14 28 (7.65%) Decision-Making
15 26 (7.10%) Data Modelling
16 24 (6.56%) Artificial Intelligence
16 24 (6.56%) User Acceptance Testing
Programming Languages
1 48 (13.11%) SQL
2 36 (9.84%) JavaScript
3 32 (8.74%) C#
4 12 (3.28%) Apex Code
5 7 (1.91%) TypeScript
6 6 (1.64%) Python
7 5 (1.37%) PowerShell
7 5 (1.37%) T-SQL
8 4 (1.09%) SOQL
9 3 (0.82%) SOSL
10 2 (0.55%) ABAP
10 2 (0.55%) R
11 1 (0.27%) Java
11 1 (0.27%) VBA
Qualifications
1 51 (13.93%) Degree
2 27 (7.38%) Security Cleared
3 17 (4.64%) Computer Science Degree
4 16 (4.37%) SC Cleared
5 14 (3.83%) Microsoft Certification
6 10 (2.73%) PMP
7 7 (1.91%) PMI Certification
8 5 (1.37%) MCPD
8 5 (1.37%) MCSD
9 4 (1.09%) BPSS Clearance
10 3 (0.82%) ISTQB
10 3 (0.82%) Six Sigma Green Belt
11 2 (0.55%) CISSP
11 2 (0.55%) MCSA
11 2 (0.55%) SAP Certification
11 2 (0.55%) TOGAF Certification
12 1 (0.27%) CompTIA CySA+
12 1 (0.27%) CSPO
12 1 (0.27%) ITIL Foundation Certificate
12 1 (0.27%) Master's Degree
Quality Assurance & Compliance
1 21 (5.74%) QA
2 16 (4.37%) Accessibility
3 14 (3.83%) GDPR
4 10 (2.73%) Data Quality
5 7 (1.91%) PMO
6 5 (1.37%) COBIT
7 4 (1.09%) ISO/IEC 27001
8 3 (0.82%) PCI DSS
8 3 (0.82%) SLA
9 2 (0.55%) California Consumer Privacy Act
10 1 (0.27%) Cyber Essentials
10 1 (0.27%) Cyber Essentials PLUS
10 1 (0.27%) ISO/IEC 27002 (supersedes ISO/IEC 17799)
10 1 (0.27%) NIST
10 1 (0.27%) Software Quality Assurance
System Software
1 3 (0.82%) Active Directory
2 1 (0.27%) Virtual Desktop
Systems Management
1 3 (0.82%) Grafana
2 2 (0.55%) Systems Management Server (SMS)
3 1 (0.27%) Computer Emergency Response Teams
3 1 (0.27%) HP ALM
3 1 (0.27%) SCCM
Vendors
1 132 (36.07%) Microsoft
2 96 (26.23%) Salesforce
3 19 (5.19%) Google
3 19 (5.19%) SAP
4 16 (4.37%) ServiceNow
5 12 (3.28%) Workday
6 11 (3.01%) Adobe
7 10 (2.73%) Oracle
8 6 (1.64%) Databricks
8 6 (1.64%) HubSpot
9 4 (1.09%) Salesforce Marketing Cloud
9 4 (1.09%) Siebel
10 3 (0.82%) Conga
10 3 (0.82%) Duck Creek
10 3 (0.82%) Guidewire
10 3 (0.82%) IFS
10 3 (0.82%) OneTrust
10 3 (0.82%) Pardot
11 2 (0.55%) BiZZdesign
11 2 (0.55%) dotdigital