CRM Contract Job Trends in London

Customer Relationship Management (CRM)
England > London

The table below provides summary statistics and contractor rates for jobs advertised in London requiring CRM skills. It covers contract job vacancies from the 6 months leading up to 11 November 2025, with comparisons to the same periods in the previous two years.

6 months to
11 Nov 2025
Same period 2024 Same period 2023
Rank 95 124 106
Rank change year-on-year +29 -18 +32
Contract jobs citing CRM 430 320 474
As % of all contract jobs in London 3.10% 2.08% 2.33%
As % of the Processes & Methodologies category 3.36% 2.33% 2.60%
Number of daily rates quoted 232 189 312
10th Percentile £285 £350 £301
25th Percentile £400 £450 £418
Median daily rate (50th Percentile) £505 £550 £500
Median % change year-on-year -8.18% +10.00% -9.09%
75th Percentile £600 £649 £625
90th Percentile £675 £745 £723
England median daily rate £500 £535 £510
% change year-on-year -6.54% +4.90% -4.45%
Number of hourly rates quoted 13 6 12
10th Percentile £17.70 £28.88 -
25th Percentile £26.57 £31.44 £17.00
Median hourly rate £34.48 £35.00 £26.50
Median % change year-on-year -1.49% +32.08% -14.00%
75th Percentile £40.75 £111.88 £29.38
90th Percentile £41.25 £137.50 £32.38
England median hourly rate £17.00 £33.25 £27.00
% change year-on-year -48.87% +23.15% +20.00%

All Process and Methodology Skills
London

CRM falls under the Processes and Methodologies category. For comparison with the information above, the following table provides summary statistics for all contract job vacancies requiring process or methodology skills in London.

Contract vacancies with a requirement for process or methodology skills 12,811 13,740 18,222
As % of all contract IT jobs advertised in London 92.42% 89.13% 89.69%
Number of daily rates quoted 8,441 8,850 13,111
10th Percentile £331 £350 £356
25th Percentile £425 £450 £463
Median daily rate (50th Percentile) £540 £550 £575
Median % change year-on-year -1.82% -4.35% -2.13%
75th Percentile £663 £675 £688
90th Percentile £775 £800 £800
England median daily rate £508 £525 £550
% change year-on-year -3.33% -4.55% -
Number of hourly rates quoted 257 161 250
10th Percentile £17.98 £17.25 £18.56
25th Percentile £25.00 £25.00 £21.50
Median hourly rate £29.50 £38.07 £37.17
Median % change year-on-year -22.51% +2.42% -0.88%
75th Percentile £47.00 £56.00 £60.00
90th Percentile £65.00 £80.75 £77.50
England median hourly rate £25.15 £36.17 £44.50
% change year-on-year -30.46% -18.73% +27.14%

CRM
Job Vacancy Trend in London

Historical trend showing the proportion of contract IT job postings citing CRM relative to all contract IT jobs advertised in London.
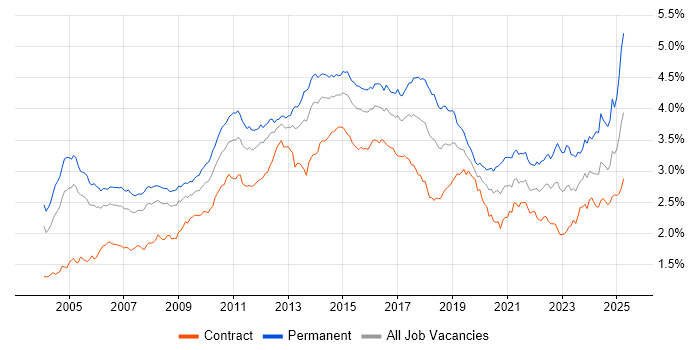
CRM job vacancy trend in London

CRM
Daily Rate Trend in London

Contractor daily rate distribution trend for jobs in London citing CRM.

Contractor daily rate distribution trend for jobs in London citing CRM

CRM
Daily Rate Histogram in London

Daily rate distribution for jobs citing CRM in London over the 6 months to 11 November 2025.

Daily rate histogram for CRM in London

CRM
Hourly Rate Trend in London

Contractor hourly rate distribution trend for jobs in London citing CRM.

Contractor hourly rate distribution trend for jobs in London citing CRM

CRM
Hourly Rate Histogram in London

Hourly rate distribution of jobs citing CRM in London over the 6 months to 11 November 2025.

Hourly rate histogram for CRM in London

CRM
Contract Job Locations in London

The table below looks at the demand and provides a guide to the median contractor rates quoted in IT jobs citing CRM within the London region over the 6 months to 11 November 2025. The 'Rank Change' column provides an indication of the change in demand within each location based on the same 6 month period last year.

Location Rank Change
on Same Period
Last Year
Matching
Contract
IT Job Ads
Median
Daily Rate
Past 6 Months
Median Daily Rate
% Change
on Same Period
Last Year
Live
Jobs
Central London +10 55 £520 -15.10% 327
West London -6 11 £488 +6.32% 26
CRM
England

CRM
Co-Occurring Skills & Capabilities in London by Category

The following tables expand on the one above by listing co-occurrences grouped by category. They cover the same employment type, locality and period, with up to 20 co-occurrences shown in each category:

Application Platforms
1 18 (4.19%) CMS
2 13 (3.02%) SharePoint
3 7 (1.63%) Confluence
4 6 (1.40%) Adobe Experience Manager
5 5 (1.16%) Microsoft Exchange
6 4 (0.93%) Appian
6 4 (0.93%) Camunda
7 2 (0.47%) Apache Airflow
7 2 (0.47%) Headless CMS
7 2 (0.47%) Moodle
8 1 (0.23%) Alfresco
8 1 (0.23%) Apache
8 1 (0.23%) Apache Solr
8 1 (0.23%) Apache Spark
8 1 (0.23%) Kentico
8 1 (0.23%) NetWeaver
8 1 (0.23%) SAP Portal
8 1 (0.23%) SAS
8 1 (0.23%) SugarCRM
Applications
1 19 (4.42%) Microsoft Excel
2 9 (2.09%) Microsoft PowerPoint
3 8 (1.86%) Microsoft Office
4 6 (1.40%) Chatbot
5 4 (0.93%) MS Visio
6 3 (0.70%) Adobe Illustrator
6 3 (0.70%) InVision
6 3 (0.70%) OmniGraffle
6 3 (0.70%) Photoshop
6 3 (0.70%) Sketch
6 3 (0.70%) UXPin
7 2 (0.47%) Microsoft Project
7 2 (0.47%) Spreadsheet
8 1 (0.23%) Camtasia
8 1 (0.23%) SPSS
Business Applications
1 129 (30.00%) Dynamics CRM
2 31 (7.21%) Salesforce CRM
3 6 (1.40%) SAP S/4HANA
4 4 (0.93%) Workday HCM
5 3 (0.70%) NetSuite
6 2 (0.47%) Eloqua
6 2 (0.47%) SAP CX
6 2 (0.47%) Shopify
6 2 (0.47%) Workfront
7 1 (0.23%) Bloomberg TOMS
7 1 (0.23%) Dynamics GP
7 1 (0.23%) Dynamics NAV
7 1 (0.23%) Endur
7 1 (0.23%) Payment Gateway
7 1 (0.23%) SAP Convergent Charging
7 1 (0.23%) SAP ERP
7 1 (0.23%) SAP FI-CA
7 1 (0.23%) SAP Oil and Gas
7 1 (0.23%) SAP SM
7 1 (0.23%) Siebel CRM
Cloud Services
1 93 (21.63%) Azure
2 91 (21.16%) Dynamics 365
3 85 (19.77%) Power Platform
4 37 (8.60%) Power Automate
5 34 (7.91%) AWS
6 31 (7.21%) PowerApps
7 28 (6.51%) Azure DevOps
8 22 (5.12%) Azure Logic Apps
8 22 (5.12%) SaaS
9 16 (3.72%) Microsoft 365
9 16 (3.72%) Serverless
10 15 (3.49%) GCP
10 15 (3.49%) Salesforce Sales Cloud
11 11 (2.56%) Microsoft Copilot
12 10 (2.33%) Azure Functions
12 10 (2.33%) Entra ID
13 8 (1.86%) PaaS
13 8 (1.86%) Snowflake
14 7 (1.63%) Miro
15 6 (1.40%) Figma
Communications & Networking
1 7 (1.63%) SMS
2 3 (0.70%) Firewall
3 2 (0.47%) Intranet
3 2 (0.47%) ISDN
3 2 (0.47%) PSTN
3 2 (0.47%) VPN
3 2 (0.47%) WebEx
4 1 (0.23%) Cisco ICM
4 1 (0.23%) DHCP
4 1 (0.23%) DNS
4 1 (0.23%) HTTP
4 1 (0.23%) Internet
4 1 (0.23%) IP Telephony
4 1 (0.23%) LAN
4 1 (0.23%) TCP/IP
4 1 (0.23%) WAN
Database & Business Intelligence
1 42 (9.77%) Power BI
2 16 (3.72%) Tableau
3 11 (2.56%) Data Lake
4 10 (2.33%) Metadata
5 7 (1.63%) BigQuery
5 7 (1.63%) Data Warehouse
5 7 (1.63%) SQL Server
5 7 (1.63%) SQL Server Reporting Services
6 6 (1.40%) SQL Server Integration Services
7 5 (1.16%) Relational Database
8 4 (0.93%) Delta Lake
8 4 (0.93%) NoSQL
8 4 (0.93%) Qlik Sense
9 3 (0.70%) Amazon Redshift
9 3 (0.70%) Looker
9 3 (0.70%) PostgreSQL
10 2 (0.47%) Amazon RDS
10 2 (0.47%) BusinessObjects
10 2 (0.47%) SQLite
11 1 (0.23%) SQL Server Analysis Services
Development Applications
1 28 (6.51%) JIRA
2 8 (1.86%) Git
3 3 (0.70%) Axure RP
3 3 (0.70%) Balsamiq
3 3 (0.70%) ER Studio
3 3 (0.70%) ERwin
3 3 (0.70%) Visual Studio
4 2 (0.47%) CircleCI
4 2 (0.47%) CocoaPods
4 2 (0.47%) Crashlytics
4 2 (0.47%) Eclipse
4 2 (0.47%) fastlane
4 2 (0.47%) Jenkins
4 2 (0.47%) MSBuild
4 2 (0.47%) Team Foundation Server
4 2 (0.47%) Xcode
5 1 (0.23%) Cucumber
5 1 (0.23%) Maven
5 1 (0.23%) PowerDesigner
5 1 (0.23%) TestRail
General
1 176 (40.93%) Social Skills
2 134 (31.16%) Marketing
3 110 (25.58%) Finance
4 63 (14.65%) Analytical Skills
5 28 (6.51%) Public Sector
6 27 (6.28%) Retail
7 24 (5.58%) Banking
8 18 (4.19%) Legal
9 16 (3.72%) Documentation Skills
10 15 (3.49%) Billing
11 12 (2.79%) Italian Language
12 11 (2.56%) Advertising
12 11 (2.56%) French Language
12 11 (2.56%) Inclusion and Diversity
12 11 (2.56%) Japanese Language
13 10 (2.33%) Back Office
13 10 (2.33%) German Language
14 9 (2.09%) Brand Awareness
14 9 (2.09%) Presentation Skills
15 8 (1.86%) Local Government
Job Titles
1 58 (13.49%) Analyst
2 53 (12.33%) Architect
3 39 (9.07%) Consultant
4 38 (8.84%) Developer
5 37 (8.60%) Business Analyst
5 37 (8.60%) Lead
6 35 (8.14%) Senior
7 22 (5.12%) Functional Consultant
7 22 (5.12%) Solutions Architect
8 21 (4.88%) Project Manager
9 20 (4.65%) Dynamics 365 Consultant
10 18 (4.19%) Marketing Manager
11 17 (3.95%) CRM Consultant
12 16 (3.72%) Senior Manager
13 13 (3.02%) CRM Analyst
14 12 (2.79%) CRM Developer
14 12 (2.79%) CRM Specialist
15 11 (2.56%) CRM Business Analyst
15 11 (2.56%) CRM Manager
15 11 (2.56%) Salesforce Architect
Libraries, Frameworks & Software Standards
1 29 (6.74%) .NET
2 20 (4.65%) REST
3 17 (3.95%) HTML
4 16 (3.72%) Lightning Web Components
5 12 (2.79%) SOAP
5 12 (2.79%) Web Services
6 11 (2.56%) JSON
7 10 (2.33%) CSS
8 9 (2.09%) XML
9 7 (1.63%) Node.js
9 7 (1.63%) OAuth
9 7 (1.63%) RESTful
10 6 (1.40%) ASP.NET Web API
10 6 (1.40%) Middleware
11 5 (1.16%) PySpark
11 5 (1.16%) React
11 5 (1.16%) Visualforce
12 4 (0.93%) ASP.NET
12 4 (0.93%) Bootstrap
12 4 (0.93%) Microsoft Graph
Miscellaneous
1 23 (5.35%) Product Ownership
2 15 (3.49%) Legacy Systems
2 15 (3.49%) Web Conferencing
3 14 (3.26%) Onboarding
4 12 (2.79%) Analytical Mindset
4 12 (2.79%) Enterprise Software
4 12 (2.79%) Marketing Technology
5 11 (2.56%) Management Information System
6 9 (2.09%) Data Structures
6 9 (2.09%) Low-Code
6 9 (2.09%) Mobile App
6 9 (2.09%) Social Media
7 8 (1.86%) AI Agents
8 7 (1.63%) Data Protection Act
9 6 (1.40%) Cloud Native
10 4 (0.93%) Greenfield Project
10 4 (0.93%) Learning Management System
10 4 (0.93%) Reinsurance
11 3 (0.70%) e-Learning
11 3 (0.70%) Foreign Exchange (FX)
Operating Systems
1 5 (1.16%) Apple iOS
2 4 (0.93%) Windows
3 3 (0.70%) Android
4 2 (0.47%) Linux
4 2 (0.47%) Windows 10
5 1 (0.23%) Mac OS X
5 1 (0.23%) Windows 7
Processes & Methodologies
1 125 (29.07%) Agile
2 84 (19.53%) Stakeholder Management
3 72 (16.74%) Migration
4 71 (16.51%) Problem-Solving
5 66 (15.35%) Business Intelligence
6 62 (14.42%) Stakeholder Engagement
7 60 (13.95%) Analytics
8 58 (13.49%) ERP
9 54 (12.56%) DevOps
10 52 (12.09%) Data Modelling
11 51 (11.86%) User Experience
12 49 (11.40%) Data Migration
13 45 (10.47%) AI
14 40 (9.30%) Customer Engagement
14 40 (9.30%) Roadmaps
15 39 (9.07%) Customer Service
16 38 (8.84%) Project Management
17 31 (7.21%) User Stories
18 30 (6.98%) CI/CD
19 28 (6.51%) Continuous Improvement
Programming Languages
1 51 (11.86%) SQL
2 40 (9.30%) JavaScript
3 31 (7.21%) C#
4 21 (4.88%) Python
5 11 (2.56%) Apex Code
5 11 (2.56%) TypeScript
6 4 (0.93%) SOQL
7 3 (0.70%) Java
7 3 (0.70%) R
7 3 (0.70%) SOSL
8 2 (0.47%) ABAP
8 2 (0.47%) Objective-C
8 2 (0.47%) Swift
9 1 (0.23%) Bicep
9 1 (0.23%) PHP
9 1 (0.23%) PL/SQL
9 1 (0.23%) PowerShell
9 1 (0.23%) Rust
9 1 (0.23%) VB
9 1 (0.23%) VBA
Qualifications
1 49 (11.40%) Degree
2 20 (4.65%) Security Cleared
3 17 (3.95%) Computer Science Degree
4 14 (3.26%) SC Cleared
5 10 (2.33%) Microsoft Certification
5 10 (2.33%) PMP
6 9 (2.09%) PMI Certification
7 4 (0.93%) DV Cleared
8 3 (0.70%) Azure Certification
8 3 (0.70%) Master's Degree
8 3 (0.70%) Six Sigma Green Belt
9 2 (0.47%) CISSP
9 2 (0.47%) ISTQB
9 2 (0.47%) MBA
9 2 (0.47%) MCP
10 1 (0.23%) CEH
10 1 (0.23%) CISM
10 1 (0.23%) MCSA
10 1 (0.23%) MCSE
10 1 (0.23%) MOS
Quality Assurance & Compliance
1 34 (7.91%) GDPR
2 28 (6.51%) Accessibility
3 20 (4.65%) QA
4 16 (3.72%) Data Quality
5 5 (1.16%) COBIT
5 5 (1.16%) WCAG
6 4 (0.93%) California Consumer Privacy Act
7 3 (0.70%) PCI DSS
7 3 (0.70%) PMO
7 3 (0.70%) SLA
8 2 (0.47%) Actionable Recommendations
8 2 (0.47%) HIPAA
9 1 (0.23%) Cyber Essentials
9 1 (0.23%) Cyber Essentials PLUS
9 1 (0.23%) ISO/IEC 27001
9 1 (0.23%) ISO/IEC 27002 (supersedes ISO/IEC 17799)
9 1 (0.23%) NIST
9 1 (0.23%) PERC
9 1 (0.23%) Sarbanes-Oxley
9 1 (0.23%) Software Quality Assurance
System Software
1 7 (1.63%) Active Directory
2 1 (0.23%) Virtual Desktop
Systems Management
1 5 (1.16%) Single Sign-On
2 3 (0.70%) Grafana
2 3 (0.70%) Systems Management Server (SMS)
3 2 (0.47%) Terraform
4 1 (0.23%) Cisco UCCE
4 1 (0.23%) Cisco UCCX
4 1 (0.23%) Computer Emergency Response Teams
4 1 (0.23%) SCCM
Vendors
1 127 (29.53%) Microsoft
2 126 (29.30%) Salesforce
3 23 (5.35%) Google
3 23 (5.35%) HubSpot
3 23 (5.35%) SAP
4 18 (4.19%) ServiceNow
5 16 (3.72%) Adobe
6 13 (3.02%) Databricks
7 9 (2.09%) Oracle
7 9 (2.09%) Salesforce Marketing Cloud
8 7 (1.63%) Guidewire
8 7 (1.63%) Workday
9 6 (1.40%) OneTrust
10 5 (1.16%) Siebel
11 4 (0.93%) Genesys
11 4 (0.93%) OpenAI
11 4 (0.93%) Pega
12 3 (0.70%) Duck Creek
12 3 (0.70%) IFS
12 3 (0.70%) Optimizely