Design Patterns Jobs in London

Design Patterns
England > London

The table below provides summary statistics for permanent job vacancies advertised in London requiring Design Patterns skills. It includes a benchmarking guide to the annual salaries offered in vacancies that cited Design Patterns over the 6 months leading up to 28 May 2025, comparing them to the same period in the previous two years.

6 months to
28 May 2025
Same period 2024 Same period 2023
Rank 235 213 123
Rank change year-on-year -22 -90 -39
Permanent jobs citing Design Patterns 164 357 976
As % of all permanent jobs advertised in London 1.31% 1.50% 2.95%
As % of the Processes & Methodologies category 1.36% 1.66% 3.09%
Number of salaries quoted 93 258 608
10th Percentile £56,250 £55,000 £60,826
25th Percentile £60,000 £62,500 £67,500
Median annual salary (50th Percentile) £70,000 £80,000 £85,000
Median % change year-on-year -12.50% -5.88% +3.03%
75th Percentile £85,000 £93,750 £110,000
90th Percentile £97,500 £123,250 £130,000
England median annual salary £70,000 £62,500 £72,500
% change year-on-year +12.00% -13.79% +7.41%

All Process and Methodology Skills
London

Design Patterns falls under the Processes and Methodologies category. For comparison with the information above, the following table provides summary statistics for all permanent job vacancies requiring process or methodology skills in London.

Permanent vacancies with a requirement for process or methodology skills 12,045 21,522 31,580
As % of all permanent jobs advertised in London 96.26% 90.48% 95.32%
Number of salaries quoted 6,842 15,847 22,804
10th Percentile £42,000 £37,500 £42,874
25th Percentile £56,250 £51,250 £55,000
Median annual salary (50th Percentile) £75,000 £70,000 £75,000
Median % change year-on-year +7.14% -6.67% +7.14%
75th Percentile £100,000 £95,000 £95,000
90th Percentile £125,000 £115,000 £115,000
England median annual salary £57,500 £55,000 £62,500
% change year-on-year +4.55% -12.00% +4.17%

Design Patterns
Job Vacancy Trend in London

Job postings citing Design Patterns as a proportion of all IT jobs advertised in London.
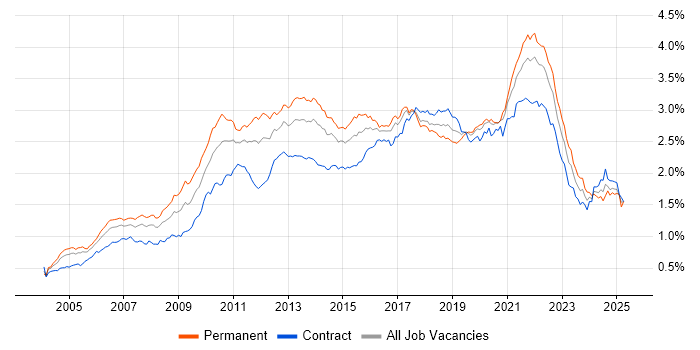
Job vacancy trend for Design Patterns in London

Design Patterns
Salary Trend in London

3-month moving average salary quoted in jobs citing Design Patterns in London.

Salary trend for Design Patterns in London

Design Patterns
Salary Histogram in London

Salary distribution for jobs citing Design Patterns in London over the 6 months to 28 May 2025.

Salary histogram for Design Patterns in London

Design Patterns
Job Locations in London

The table below looks at the demand and provides a guide to the median salaries quoted in IT jobs citing Design Patterns within the London region over the 6 months to 28 May 2025. The 'Rank Change' column provides an indication of the change in demand within each location based on the same 6 month period last year.

Location Rank Change
on Same Period
Last Year
Matching
Permanent
IT Job Ads
Median Salary
Past 6 Months
Median Salary
% Change
on Same Period
Last Year
Live
Jobs
Central London +28 40 £70,000 -22.22% 37
South London -14 7 £60,000 -25.00% 5
West London +26 2 - - 47
East London -18 2 - - 9
North London - 1 £75,000 -
Design Patterns
England

Design Patterns
Co-occurring Skills and Capabilities in London by Category

The follow tables expand on the table above by listing co-occurrences grouped by category. The same employment type, locality and period is covered with up to 20 co-occurrences shown in each of the following categories:

Application Platforms
1 7 (4.27%) Confluence
2 4 (2.44%) CMS
2 4 (2.44%) WordPress
3 3 (1.83%) Apache Airflow
4 2 (1.22%) Microsoft Exchange
4 2 (1.22%) SharePoint
5 1 (0.61%) Apache
5 1 (0.61%) Drupal
5 1 (0.61%) Ethereum
5 1 (0.61%) NServiceBus
5 1 (0.61%) OpenStack
5 1 (0.61%) Oracle SOA Suite
Applications
1 3 (1.83%) UserZoom
2 2 (1.22%) Adobe XD
2 2 (1.22%) MS Visio
2 2 (1.22%) Sketch
Business Applications
1 4 (2.44%) Oracle EBS
Cloud Services
1 56 (34.15%) AWS
2 55 (33.54%) Azure
3 26 (15.85%) AWS CloudFormation
4 21 (12.80%) GCP
5 18 (10.98%) GitHub
6 17 (10.37%) Serverless
7 14 (8.54%) AWS Lambda
8 12 (7.32%) Amazon EKS
8 12 (7.32%) AWS KMS
8 12 (7.32%) Azure DevOps
8 12 (7.32%) GitHub Actions
9 9 (5.49%) Figma
10 8 (4.88%) Azure Service Bus
11 4 (2.44%) Boomi
11 4 (2.44%) Salesforce Sales Cloud
11 4 (2.44%) Salesforce Service Cloud
12 3 (1.83%) Cloud Composer
12 3 (1.83%) Google Analytics
12 3 (1.83%) SaaS
13 2 (1.22%) Azure Logic Apps
Communications & Networking
1 15 (9.15%) Network Security
2 4 (2.44%) HTTP
3 3 (1.83%) VPN
4 2 (1.22%) DNS
4 2 (1.22%) Unified Communications
5 1 (0.61%) BGP
5 1 (0.61%) Cisco IOS
5 1 (0.61%) IOS XR
5 1 (0.61%) MPLS
5 1 (0.61%) Multicast
5 1 (0.61%) OSPF
5 1 (0.61%) SSH
5 1 (0.61%) TCP/IP
Database & Business Intelligence
1 16 (9.76%) MySQL
2 14 (8.54%) SQL Server
3 13 (7.93%) Elasticsearch
4 10 (6.10%) MongoDB
4 10 (6.10%) NoSQL
4 10 (6.10%) PostgreSQL
5 5 (3.05%) Relational Database
6 3 (1.83%) Azure SQL Database
6 3 (1.83%) BigQuery
6 3 (1.83%) Data Lake
6 3 (1.83%) Data Warehouse
6 3 (1.83%) Looker
7 2 (1.22%) Redis
8 1 (0.61%) Apache Cassandra
8 1 (0.61%) Big Data
8 1 (0.61%) CouchDB
8 1 (0.61%) MS Access
8 1 (0.61%) RDBMS
Development Applications
1 36 (21.95%) Git
2 15 (9.15%) Jenkins
3 13 (7.93%) Gradle
4 11 (6.71%) SonarQube
5 10 (6.10%) JIRA
6 9 (5.49%) Jasmine
6 9 (5.49%) Mocha
7 8 (4.88%) NUnit
8 7 (4.27%) webpack
9 6 (3.66%) Grunt
9 6 (3.66%) JUnit
9 6 (3.66%) Maven
10 5 (3.05%) Atlassian Bamboo
10 5 (3.05%) PHPUnit
11 4 (2.44%) AppScan
12 3 (1.83%) CircleCI
12 3 (1.83%) GitLab
13 2 (1.22%) MSTest
14 1 (0.61%) RSpec
14 1 (0.61%) TeamCity
General
1 53 (32.32%) Social Skills
2 45 (27.44%) Finance
3 33 (20.12%) Inclusion and Diversity
4 23 (14.02%) Analytical Skills
5 13 (7.93%) Banking
5 13 (7.93%) Games
6 9 (5.49%) Public Sector
7 8 (4.88%) Front Office
8 6 (3.66%) Marketing
8 6 (3.66%) Retail Banking
9 4 (2.44%) Retail
10 3 (1.83%) Documentation Skills
10 3 (1.83%) Influencing Skills
10 3 (1.83%) Manufacturing
11 2 (1.22%) Law
11 2 (1.22%) Publishing
11 2 (1.22%) Telecoms
12 1 (0.61%) Investment Banking
12 1 (0.61%) Police
12 1 (0.61%) Presentation Skills
Job Titles
1 82 (50.00%) Developer
2 33 (20.12%) Lead
3 31 (18.90%) Architect
4 28 (17.07%) Senior
5 20 (12.20%) Software Developer
6 16 (9.76%) Lead Developer
6 16 (9.76%) Senior Developer
7 14 (8.54%) Cloud Architect
8 13 (7.93%) .NET Developer
8 13 (7.93%) C# Developer
8 13 (7.93%) Software Engineer
9 12 (7.32%) AWS Architect
9 12 (7.32%) iOS Developer
10 11 (6.71%) Release Manager
11 10 (6.10%) Technical Architect
12 9 (5.49%) React Developer
12 9 (5.49%) Technical Leader
13 8 (4.88%) C# .NET Developer
13 8 (4.88%) Lead Architect
14 7 (4.27%) Lead Android Developer
Libraries, Frameworks & Software Standards
1 43 (26.22%) .NET
2 39 (23.78%) React
3 29 (17.68%) CSS
3 29 (17.68%) Kafka
4 28 (17.07%) AngularJS
5 23 (14.02%) HTML
5 23 (14.02%) Node.js
5 23 (14.02%) RESTful
6 19 (11.59%) Elastic Stack
7 17 (10.37%) Vue
8 15 (9.15%) Jest
9 12 (7.32%) Pandas
10 11 (6.71%) Redux
10 11 (6.71%) Sass
10 11 (6.71%) Spring
11 10 (6.10%) jQuery
12 9 (5.49%) .NET Core
12 9 (5.49%) .NET Framework
12 9 (5.49%) Ajax
12 9 (5.49%) LESS
Miscellaneous
1 18 (10.98%) Management Information System
1 18 (10.98%) Mobile App
2 16 (9.76%) Distributed Systems
3 15 (9.15%) Cloud Native
4 14 (8.54%) Cyberattack
5 13 (7.93%) Legacy Systems
6 12 (7.32%) Algorithms
6 12 (7.32%) Mobile Games
7 11 (6.71%) Product Ownership
8 10 (6.10%) Data Structures
8 10 (6.10%) Foreign Exchange (FX)
9 8 (4.88%) Fixed Income
10 5 (3.05%) Hackathon
10 5 (3.05%) Hedge funds
11 4 (2.44%) Equities
12 2 (1.22%) BYOD
12 2 (1.22%) Greenfield Project
12 2 (1.22%) Legacy Applications
12 2 (1.22%) Public Cloud
12 2 (1.22%) Virtual Team
Operating Systems
1 26 (15.85%) Android
2 18 (10.98%) Linux
3 17 (10.37%) Apple iOS
4 1 (0.61%) Windows
Processes & Methodologies
1 90 (54.88%) Agile
2 75 (45.73%) CI/CD
3 70 (42.68%) Software Engineering
4 66 (40.24%) DevOps
5 47 (28.66%) Mentoring
6 43 (26.22%) Containerisation
7 42 (25.61%) Microservices
8 37 (22.56%) SOLID
9 36 (21.95%) OO
9 36 (21.95%) OOP
10 35 (21.34%) Computer Science
11 33 (20.12%) Architectural Patterns
12 32 (19.51%) Problem-Solving
12 32 (19.51%) Technical Leadership
13 24 (14.63%) Performance Tuning
14 23 (14.02%) Architectural Design
14 23 (14.02%) Event-Driven
14 23 (14.02%) Event-Driven Architecture
14 23 (14.02%) Product Management
15 22 (13.41%) Clean Code
Programming Languages
1 60 (36.59%) Java
2 52 (31.71%) JavaScript
3 31 (18.90%) C#
3 31 (18.90%) SQL
4 26 (15.85%) Python
5 20 (12.20%) C++
6 19 (11.59%) TypeScript
7 17 (10.37%) Go
8 14 (8.54%) Rust
9 12 (7.32%) PHP
9 12 (7.32%) Swift
10 10 (6.10%) Objective-C
11 9 (5.49%) Kotlin
12 6 (3.66%) Apex Code
12 6 (3.66%) Ruby
13 4 (2.44%) Bash
14 3 (1.83%) C
15 2 (1.22%) PowerShell
16 1 (0.61%) SOQL
16 1 (0.61%) T-SQL
Qualifications
1 42 (25.61%) Security Cleared
2 36 (21.95%) Degree
3 32 (19.51%) Computer Science Degree
4 26 (15.85%) SC Cleared
5 20 (12.20%) AWS Certification
6 19 (11.59%) AWS Certified Solutions Architect
7 14 (8.54%) DV Cleared
8 4 (2.44%) Master's Degree
9 2 (1.22%) PhD
9 2 (1.22%) TOGAF Certification
10 1 (0.61%) CCIE
10 1 (0.61%) Cisco Certification
Quality Assurance & Compliance
1 22 (13.41%) QA
2 18 (10.98%) GDPR
3 16 (9.76%) HIPAA
4 6 (3.66%) ISO/IEC 27001
5 4 (2.44%) SLA
5 4 (2.44%) SOC 2
6 2 (1.22%) Accessibility
6 2 (1.22%) California Consumer Privacy Act
6 2 (1.22%) NCSC
6 2 (1.22%) PCI DSS
7 1 (0.61%) Data Quality
7 1 (0.61%) WCAG
System Software
1 60 (36.59%) Docker
2 1 (0.61%) Virtual Machines
Systems Management
1 56 (34.15%) Kubernetes
2 30 (18.29%) Terraform
3 19 (11.59%) Prometheus
4 18 (10.98%) Ansible
5 15 (9.15%) Grafana
6 5 (3.05%) Argo
6 5 (3.05%) Progress Chef
6 5 (3.05%) Puppet
Vendors
1 15 (9.15%) Microsoft
2 13 (7.93%) New Relic
3 11 (6.71%) Google
4 10 (6.10%) Salesforce
5 6 (3.66%) Oracle
6 4 (2.44%) Atlassian
6 4 (2.44%) Dell
6 4 (2.44%) Informatica
6 4 (2.44%) MuleSoft
6 4 (2.44%) Okta
7 3 (1.83%) Adobe
7 3 (1.83%) Snowplow
8 2 (1.22%) Apple
8 2 (1.22%) Trayport
9 1 (0.61%) Cisco
9 1 (0.61%) IBM