Microsoft Excel Jobs in London

Microsoft Excel
England > London

The table below provides summary statistics for permanent job vacancies advertised in London requiring Microsoft Excel skills. It includes a benchmarking guide to the annual salaries offered in vacancies that cited Microsoft Excel over the 6 months leading up to 19 May 2025, comparing them to the same period in the previous two years.

6 months to
19 May 2025
Same period 2024 Same period 2023
Rank 83 45 102
Rank change year-on-year -38 +57 +70
Permanent jobs citing Microsoft Excel 501 1,234 1,120
As % of all permanent jobs advertised in London 3.89% 5.21% 3.33%
As % of the Applications category 32.87% 53.58% 42.47%
Number of salaries quoted 273 542 671
10th Percentile £28,898 £29,288 £33,500
25th Percentile £41,000 £37,500 £42,831
Median annual salary (50th Percentile) £55,000 £54,000 £57,500
Median % change year-on-year +1.85% -6.09% +4.55%
75th Percentile £77,500 £70,000 £71,250
90th Percentile £93,500 £84,875 £83,750
England median annual salary £46,000 £40,000 £45,000
% change year-on-year +15.00% -11.11% -

All Software Application Skills
London

Microsoft Excel falls under the Software Applications category. For comparison with the information above, the following table provides summary statistics for all permanent job vacancies requiring software application skills in London.

Permanent vacancies with a requirement for software application skills 1,524 2,303 2,637
As % of all permanent jobs advertised in London 11.84% 9.73% 7.85%
Number of salaries quoted 649 1,351 1,761
10th Percentile £30,625 £27,965 £31,250
25th Percentile £40,000 £33,189 £38,750
Median annual salary (50th Percentile) £50,157 £47,500 £55,000
Median % change year-on-year +5.59% -13.64% -
75th Percentile £75,000 £67,500 £72,500
90th Percentile £92,500 £82,500 £90,000
England median annual salary £47,683 £37,786 £45,000
% change year-on-year +26.19% -16.03% -

Microsoft Excel
Job Vacancy Trend in London

Job postings citing Microsoft Excel as a proportion of all IT jobs advertised in London.
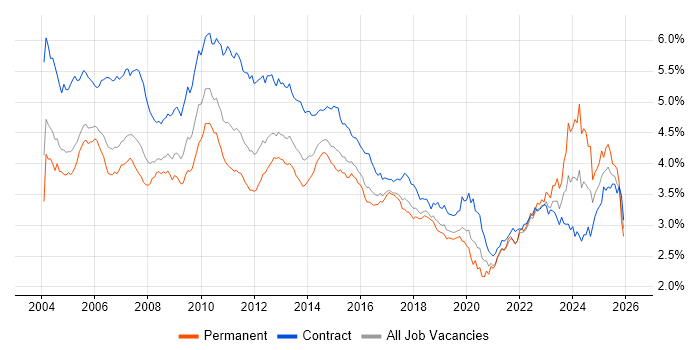
Job vacancy trend for Microsoft Excel in London

Microsoft Excel
Salary Trend in London

3-month moving average salary quoted in jobs citing Microsoft Excel in London.

Salary trend for Microsoft Excel in London

Microsoft Excel
Salary Histogram in London

Salary distribution for jobs citing Microsoft Excel in London over the 6 months to 19 May 2025.

Salary histogram for Microsoft Excel in London

Microsoft Excel
Job Locations in London

The table below looks at the demand and provides a guide to the median salaries quoted in IT jobs citing Microsoft Excel within the London region over the 6 months to 19 May 2025. The 'Rank Change' column provides an indication of the change in demand within each location based on the same 6 month period last year.

Location Rank Change
on Same Period
Last Year
Matching
Permanent
IT Job Ads
Median Salary
Past 6 Months
Median Salary
% Change
on Same Period
Last Year
Live
Jobs
Central London +19 130 £50,000 -13.04% 45
West London -28 17 £62,500 +120.93% 33
South London -74 10 £51,750 +15.00% 9
East London -15 5 £90,000 +95.65% 12
Microsoft Excel
England

Microsoft Excel
Co-occurring Skills and Capabilities in London by Category

The follow tables expand on the table above by listing co-occurrences grouped by category. The same employment type, locality and period is covered with up to 20 co-occurrences shown in each of the following categories:

Application Platforms
1 33 (6.59%) SharePoint
2 28 (5.59%) Microsoft Exchange
3 18 (3.59%) Confluence
4 14 (2.79%) CMS
5 8 (1.60%) SAS
6 7 (1.40%) Sitecore CMS
7 5 (1.00%) Kinematics
8 3 (0.60%) Apache Airflow
8 3 (0.60%) nginx
9 2 (0.40%) Apache Spark
9 2 (0.40%) Skype for Business
9 2 (0.40%) WordPress
10 1 (0.20%) MTS
Applications
1 150 (29.94%) Microsoft PowerPoint
2 133 (26.55%) Microsoft Office
3 41 (8.18%) MS Visio
4 19 (3.79%) Microsoft Project
5 8 (1.60%) SOLIDWORKS
6 5 (1.00%) Photoshop
7 4 (0.80%) Spreadsheet
8 3 (0.60%) Adobe Creative Suite
8 3 (0.60%) Trello
9 2 (0.40%) Adobe Illustrator
9 2 (0.40%) InDesign
10 1 (0.20%) Camtasia
10 1 (0.20%) Sketch
10 1 (0.20%) SPSS
10 1 (0.20%) Stata
Business Applications
1 10 (2.00%) Dynamics NAV
2 5 (1.00%) Infor SunSystems
3 4 (0.80%) iTrent
3 4 (0.80%) Raiser’s Edge
3 4 (0.80%) Relativity
3 4 (0.80%) Ringtail
3 4 (0.80%) Veritas eDiscovery
4 3 (0.60%) CA PPM
5 2 (0.40%) Endur
5 2 (0.40%) Oracle General Ledger
5 2 (0.40%) Oracle Payables
5 2 (0.40%) Oracle Receivables
6 1 (0.20%) Elite 3E
6 1 (0.20%) Maximo
6 1 (0.20%) NEC Housing
6 1 (0.20%) Primavera
6 1 (0.20%) SAP CO
6 1 (0.20%) SAP FI
6 1 (0.20%) SAP FI/CO
6 1 (0.20%) Temenos T24
Cloud Services
1 109 (21.76%) Power Platform
2 44 (8.78%) Microsoft 365
3 37 (7.39%) Azure
4 31 (6.19%) AWS
5 27 (5.39%) SaaS
6 19 (3.79%) Google Analytics
7 18 (3.59%) Entra ID
8 17 (3.39%) Google Sheets
9 16 (3.19%) Snowflake
10 13 (2.59%) Dynamics 365
11 11 (2.20%) OneDrive
12 9 (1.80%) IaaS
13 8 (1.60%) Azure DevOps
13 8 (1.60%) PaaS
14 7 (1.40%) Google Ads
15 6 (1.20%) Azure Data Factory
15 6 (1.20%) Dropbox
15 6 (1.20%) Google Docs
15 6 (1.20%) Google Drive
16 5 (1.00%) dbt
Communications & Networking
1 13 (2.59%) DNS
2 12 (2.40%) DHCP
3 8 (1.60%) Cisco IOS
3 8 (1.60%) FTP
3 8 (1.60%) IPv4
3 8 (1.60%) PBX
3 8 (1.60%) SAN
3 8 (1.60%) SMTP
3 8 (1.60%) Structured Cabling
3 8 (1.60%) VLAN
4 3 (0.60%) Telnet
4 3 (0.60%) Wi-Fi
5 2 (0.40%) Firewall
5 2 (0.40%) Intranet
5 2 (0.40%) MQTT
5 2 (0.40%) Skype
5 2 (0.40%) Softphone
5 2 (0.40%) WebEx
6 1 (0.20%) Unified Communications
6 1 (0.20%) WAN
Database & Business Intelligence
1 109 (21.76%) Power BI
2 30 (5.99%) Tableau
3 29 (5.79%) Relational Database
4 23 (4.59%) Data Warehouse
5 19 (3.79%) SQL Server
6 17 (3.39%) Big Data
7 15 (2.99%) GIS
8 11 (2.20%) Oracle Reports
9 10 (2.00%) Power Query
10 9 (1.80%) Amazon RDS
10 9 (1.80%) MySQL
10 9 (1.80%) SQL Server Reporting Services
11 7 (1.40%) BusinessObjects
12 6 (1.20%) Data Mining
13 5 (1.00%) Data Lake
13 5 (1.00%) SQL Server Integration Services
14 4 (0.80%) EDRMS
15 3 (0.60%) Looker
15 3 (0.60%) Metadata
15 3 (0.60%) MS Access
Development Applications
1 32 (6.39%) JIRA
2 7 (1.40%) Git
3 5 (1.00%) SoapUI
4 4 (0.80%) Postman
5 2 (0.40%) MSI
6 1 (0.20%) Bitbucket
6 1 (0.20%) GitLab
6 1 (0.20%) Team Foundation Server
6 1 (0.20%) Visual Studio
General
1 274 (54.69%) Social Skills
2 210 (41.92%) Finance
3 153 (30.54%) Analytical Skills
4 62 (12.38%) Marketing
5 55 (10.98%) Law
6 45 (8.98%) Presentation Skills
7 41 (8.18%) Legal
8 39 (7.78%) Organisational Skills
9 31 (6.19%) Banking
10 28 (5.59%) Inclusion and Diversity
11 27 (5.39%) Telecoms
12 25 (4.99%) Retail
13 19 (3.79%) Advertising
13 19 (3.79%) German Language
14 17 (3.39%) Publishing
15 14 (2.79%) Local Government
16 13 (2.59%) Public Sector
17 11 (2.20%) French Language
18 10 (2.00%) Italian Language
19 9 (1.80%) Manufacturing
Job Titles
1 206 (41.12%) Analyst
2 60 (11.98%) Senior
3 41 (8.18%) Support Analyst
4 39 (7.78%) Data Analyst
5 36 (7.19%) Financial Analyst
6 34 (6.79%) Consultant
7 33 (6.59%) IT Analyst
8 27 (5.39%) Business Analyst
9 25 (4.99%) IT Support
10 22 (4.39%) IT Support Analyst
11 21 (4.19%) Project Manager
12 20 (3.99%) Support Specialist
13 17 (3.39%) Senior Analyst
14 16 (3.19%) IT Support Specialist
14 16 (3.19%) Systems Analyst
15 15 (2.99%) Senior Manager
16 14 (2.79%) Analytics Consultant
16 14 (2.79%) GIS Consultant
16 14 (2.79%) Spatial Consultant
17 13 (2.59%) Lead
Libraries, Frameworks & Software Standards
1 9 (1.80%) .NET
2 6 (1.20%) FIX Protocol
3 5 (1.00%) XML
4 4 (0.80%) EDI
5 3 (0.60%) JSON
5 3 (0.60%) LEMP Stack
5 3 (0.60%) Pandas
6 2 (0.40%) AngularJS
6 2 (0.40%) HTML
6 2 (0.40%) Lightning Web Components
6 2 (0.40%) MDX
6 2 (0.40%) Oracle Fusion
6 2 (0.40%) PySpark
6 2 (0.40%) React
6 2 (0.40%) Regular Expression
6 2 (0.40%) REST
6 2 (0.40%) RESTful
7 1 (0.20%) ASP.NET
7 1 (0.20%) CSS
7 1 (0.20%) XSD
Miscellaneous
1 64 (12.77%) Management Information System
2 23 (4.59%) Onboarding
3 21 (4.19%) Video Conferencing
4 19 (3.79%) Social Media
5 18 (3.59%) Analytical Mindset
5 18 (3.59%) Self-Motivation
6 11 (2.20%) Data Structures
7 8 (1.60%) Blog
7 8 (1.60%) Digital Media
7 8 (1.60%) Private Cloud
7 8 (1.60%) Public Cloud
8 7 (1.40%) Foreign Exchange (FX)
8 7 (1.40%) PMI
9 6 (1.20%) Housing Association
10 5 (1.00%) Derivative
10 5 (1.00%) Driving Licence
10 5 (1.00%) Fixed Income
10 5 (1.00%) Legacy Systems
10 5 (1.00%) Reference Data
11 4 (0.80%) Animation
Operating Systems
1 50 (9.98%) Windows
2 28 (5.59%) Linux
3 23 (4.59%) Unix
4 15 (2.99%) Windows 10
5 12 (2.40%) Windows Server
6 8 (1.60%) Android
7 7 (1.40%) Apple iOS
8 3 (0.60%) Mac OS
8 3 (0.60%) Rocky
8 3 (0.60%) Ubuntu
9 2 (0.40%) CentOS
9 2 (0.40%) Red Hat Enterprise Linux
10 1 (0.20%) Debian
10 1 (0.20%) zOS
Processes & Methodologies
1 127 (25.35%) Business Intelligence
2 113 (22.55%) Analytics
3 112 (22.36%) Problem-Solving
4 76 (15.17%) Project Management
5 66 (13.17%) Data Analysis
6 54 (10.78%) Data Management
7 51 (10.18%) Visualisation
8 48 (9.58%) Decision-Making
9 44 (8.78%) Actionable Insight
10 41 (8.18%) Mentoring
11 38 (7.58%) Continuous Improvement
11 38 (7.58%) Time Management
12 37 (7.39%) Change Management
13 35 (6.99%) Agile
13 35 (6.99%) Collaborative Working
13 35 (6.99%) Computer Science
14 34 (6.79%) Customer Service
15 33 (6.59%) CRM
16 32 (6.39%) ITIL
17 31 (6.19%) Stakeholder Management
Programming Languages
1 151 (30.14%) SQL
2 62 (12.38%) Python
3 26 (5.19%) VBA
4 18 (3.59%) T-SQL
5 15 (2.99%) PowerShell
6 9 (1.80%) JavaScript
6 9 (1.80%) VB
7 8 (1.60%) Bash
8 7 (1.40%) C#
8 7 (1.40%) Data Analysis Expressions
8 7 (1.40%) R
9 4 (0.80%) PHP
10 3 (0.60%) Java
10 3 (0.60%) VB.NET
11 1 (0.20%) Assembly Language
11 1 (0.20%) C
11 1 (0.20%) C++
11 1 (0.20%) JCL
11 1 (0.20%) PL/SQL
11 1 (0.20%) REXX
Qualifications
1 149 (29.74%) Degree
2 16 (3.19%) A+ Certification
3 14 (2.79%) ACCA
3 14 (2.79%) CIMA
4 11 (2.20%) Microsoft Certification
5 10 (2.00%) CCNA
5 10 (2.00%) Cisco Certification
5 10 (2.00%) Master's Degree
6 8 (1.60%) Network+ Certification
7 7 (1.40%) PMI Certification
8 6 (1.20%) DBS Check
9 4 (0.80%) Computer Science Degree
10 3 (0.60%) CBAP
10 3 (0.60%) MBA
10 3 (0.60%) PRINCE2 Practitioner
11 2 (0.40%) CCAB
11 2 (0.40%) CFA
11 2 (0.40%) CISM
11 2 (0.40%) CISSP
11 2 (0.40%) MCT
Quality Assurance & Compliance
1 25 (4.99%) QA
2 22 (4.39%) Data Quality
2 22 (4.39%) PMO
3 12 (2.40%) GDPR
4 10 (2.00%) Accessibility
5 5 (1.00%) ISO/IEC 27001
5 5 (1.00%) SLA
6 4 (0.80%) ISO 9001
7 3 (0.60%) GRC
7 3 (0.60%) NIST
7 3 (0.60%) P3O
8 1 (0.20%) California Consumer Privacy Act
8 1 (0.20%) COBIT
8 1 (0.20%) Cyber Essentials
8 1 (0.20%) DICOM
8 1 (0.20%) HL7
8 1 (0.20%) IFRS
8 1 (0.20%) NIST 800
8 1 (0.20%) PCI DSS
8 1 (0.20%) Solvency II
System Software
1 28 (5.59%) Active Directory
2 9 (1.80%) VMware Infrastructure
3 8 (1.60%) Hyper-V
3 8 (1.60%) Virtual Desktop
3 8 (1.60%) VMware ESXi
4 3 (0.60%) Samba
5 1 (0.20%) Job Entry Subsystem
5 1 (0.20%) Time Sharing Option
5 1 (0.20%) Virtual Machines
5 1 (0.20%) vSphere
Systems Management
1 22 (4.39%) Microsoft Intune
2 8 (1.60%) SCCM
2 8 (1.60%) WSUS
3 3 (0.60%) Grafana
4 2 (0.40%) RSA Archer
5 1 (0.20%) Computer Emergency Response Teams
Vendors
1 249 (49.70%) Microsoft
2 33 (6.59%) Google
3 29 (5.79%) Oracle
4 23 (4.59%) Salesforce
5 18 (3.59%) Alteryx
5 18 (3.59%) SAP
6 14 (2.79%) Cisco
7 11 (2.20%) VMware
8 10 (2.00%) Citrix
8 10 (2.00%) ServiceNow
9 9 (1.80%) Apple
10 8 (1.60%) Adobe
10 8 (1.60%) Veeam
11 7 (1.40%) Ahrefs
11 7 (1.40%) Screaming Frog
11 7 (1.40%) Sitecore
12 6 (1.20%) ATG
13 5 (1.00%) Infor
13 5 (1.00%) Sun
14 4 (0.80%) YouTube