Regulatory Compliance Jobs in England

Regulatory Compliance
UK > England

The table below provides summary statistics for permanent job vacancies advertised in England requiring Regulatory Compliance skills. It includes a benchmarking guide to the annual salaries offered in vacancies that cited Regulatory Compliance over the 6 months leading up to 27 August 2025, comparing them to the same period in the previous two years.

6 months to
27 Aug 2025
Same period 2024 Same period 2023
Rank 311 489 585
Rank change year-on-year +178 +96 -20
DemandTrendPermanent jobs citing Regulatory Compliance 412 293 207
As % of all permanent jobs advertised in England 0.86% 0.39% 0.33%
As % of the Processes & Methodologies category 0.97% 0.48% 0.35%
Number of salaries quoted 222 178 110
10th Percentile £41,250 £45,459 £46,176
25th Percentile £50,000 £52,500 £60,000
Median annual salary (50th Percentile) £72,500 £67,500 £80,000
Median % change year-on-year +7.41% -15.63% +14.29%
75th Percentile £92,500 £92,500 £115,000
90th Percentile £127,500 £105,000 £128,125
UK median annual salary £72,500 £67,500 £77,500
% change year-on-year +7.41% -12.90% +16.98%

All Process and Methodology Skills
England

Regulatory Compliance falls under the Processes and Methodologies category. For comparison with the information above, the following table provides summary statistics for all permanent job vacancies requiring process or methodology skills in England.

DemandTrendPermanent vacancies with a requirement for process or methodology skills 42,275 61,047 59,184
As % of all permanent jobs advertised in England 88.07% 81.46% 94.87%
Number of salaries quoted 23,066 37,514 40,883
10th Percentile £27,250 £31,250 £33,750
25th Percentile £36,250 £41,250 £45,250
Median annual salary (50th Percentile) £55,000 £56,225 £62,500
Median % change year-on-year -2.18% -10.04% +4.17%
75th Percentile £75,000 £75,000 £81,250
90th Percentile £97,500 £95,000 £100,000
UK median annual salary £54,793 £55,000 £60,000
% change year-on-year -0.38% -8.33% -

Regulatory Compliance
Job Vacancy Trend in England

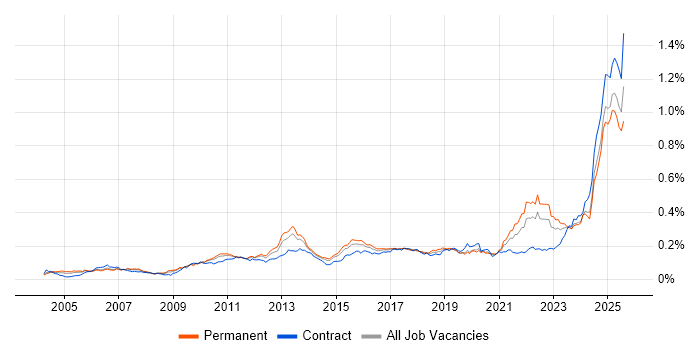
Job postings citing Regulatory Compliance as a proportion of all IT jobs advertised in England.

Job vacancy trend for Regulatory Compliance in England

Regulatory Compliance
Salary Trend in England

Salary distribution trend for jobs in England citing Regulatory Compliance.

Salary distribution trend for jobs in England citing Regulatory Compliance

Regulatory Compliance
Salary Histogram in England

Salary distribution for jobs citing Regulatory Compliance in England over the 6 months to 27 August 2025.

Salary histogram for Regulatory Compliance in England

Regulatory Compliance
Job Locations in England

The table below looks at the demand and provides a guide to the median salaries quoted in IT jobs citing Regulatory Compliance within the England region over the 6 months to 27 August 2025. The 'Rank Change' column provides an indication of the change in demand within each location based on the same 6 month period last year.

Location Rank Change
on Same Period
Last Year
Matching
DemandTrendPermanent
IT Job Ads
Median Salary
Past 6 Months
Median Salary
% Change
on Same Period
Last Year
Live
Jobs
London +143 191 £90,000 +12.50% 183
South East +85 108 £55,000 -18.52% 130
Midlands +71 35 £45,000 -17.05% 20
North of England +27 35 £50,000 -14.89% 32
West Midlands +59 27 £45,000 -14.29% 10
North West +25 27 £50,000 -0.80% 23
East of England -3 20 £50,000 -33.28% 17
South West +65 15 £72,500 +7.41% 19
East Midlands +31 8 - - 10
Yorkshire +15 4 £57,500 -37.84% 8
North East +9 4 £70,000 +21.74% 1
Regulatory Compliance
UK

Regulatory Compliance
Co-occurring Skills and Capabilities in England by Category

The follow tables expand on the table above by listing co-occurrences grouped by category. The same employment type, locality and period is covered with up to 20 co-occurrences shown in each of the following categories:

Application Platforms
1 29 (7.04%) CMS
2 16 (3.88%) Apache Spark
3 8 (1.94%) Microsoft Exchange
4 7 (1.70%) SharePoint
5 5 (1.21%) Confluence
6 3 (0.73%) Apache Airflow
6 3 (0.73%) SAS
7 2 (0.49%) ArcGIS
8 1 (0.24%) JBoss
Applications
1 27 (6.55%) Microsoft Excel
2 17 (4.13%) Microsoft Office
3 10 (2.43%) Microsoft Project
3 10 (2.43%) MS Visio
4 8 (1.94%) Microsoft PowerPoint
4 8 (1.94%) Trello
5 5 (1.21%) Spreadsheet
6 2 (0.49%) Adobe Creative Suite
6 2 (0.49%) Adobe Illustrator
7 1 (0.24%) AutoCAD
7 1 (0.24%) MicroStation
Business Applications
1 10 (2.43%) SAP S/4HANA
2 9 (2.18%) NetSuite
3 3 (0.73%) Dynamics CRM
4 2 (0.49%) Relativity
4 2 (0.49%) Sage 200
5 1 (0.24%) Adaptiv
5 1 (0.24%) SAP GRC
5 1 (0.24%) SAP MM
5 1 (0.24%) SAP PLM
5 1 (0.24%) Sparx Enterprise Architect
Cloud Services
1 112 (27.18%) Azure
2 58 (14.08%) SaaS
3 54 (13.11%) AWS
4 38 (9.22%) GCP
4 38 (9.22%) PaaS
5 29 (7.04%) iPaaS
6 28 (6.80%) Power Platform
7 21 (5.10%) Cloud Computing
8 19 (4.61%) Microsoft 365
9 15 (3.64%) AWS CloudFormation
9 15 (3.64%) Azure Sentinel
9 15 (3.64%) Serverless
10 14 (3.40%) Azure Synapse Analytics
10 14 (3.40%) Entra ID
11 13 (3.16%) Azure DevOps
12 12 (2.91%) AWS Lambda
13 11 (2.67%) Snowflake
14 10 (2.43%) Power Automate
15 9 (2.18%) GitHub
16 8 (1.94%) GitHub Actions
Communications & Networking
1 26 (6.31%) Network Security
2 21 (5.10%) Firewall
3 10 (2.43%) VPN
4 7 (1.70%) TCP/IP
5 6 (1.46%) DHCP
5 6 (1.46%) DNS
5 6 (1.46%) NGFW
6 4 (0.97%) WAN
7 3 (0.73%) Intrusion Detection
7 3 (0.73%) Wireless
8 1 (0.24%) DKIM
8 1 (0.24%) DMARC
8 1 (0.24%) Intranet
8 1 (0.24%) LAN
Database & Business Intelligence
1 27 (6.55%) Power BI
2 25 (6.07%) Data Warehouse
3 23 (5.58%) NoSQL
4 19 (4.61%) Big Data
5 15 (3.64%) Hadoop
6 14 (3.40%) Amazon Redshift
7 13 (3.16%) BigQuery
7 13 (3.16%) Data Lake
7 13 (3.16%) GIS
8 12 (2.91%) Metadata
9 7 (1.70%) Relational Database
10 4 (0.97%) Tableau
11 3 (0.73%) Ataccama
11 3 (0.73%) PostgreSQL
11 3 (0.73%) SQL Server
12 2 (0.49%) Data Mining
12 2 (0.49%) EDRMS
12 2 (0.49%) Electronic Patient Records
12 2 (0.49%) Redis
12 2 (0.49%) Spark SQL
Development Applications
1 14 (3.40%) JIRA
2 5 (1.21%) Jenkins
3 3 (0.73%) ER Studio
3 3 (0.73%) ERwin
3 3 (0.73%) GitLab
4 2 (0.49%) Git
4 2 (0.49%) MLflow
5 1 (0.24%) CircleCI
5 1 (0.24%) MagicDraw
5 1 (0.24%) Octopus Deploy
5 1 (0.24%) Visual Studio
General
1 245 (59.47%) Social Skills
2 200 (48.54%) Finance
3 112 (27.18%) Analytical Skills
4 100 (24.27%) Legal
5 49 (11.89%) Law
6 45 (10.92%) Organisational Skills
7 42 (10.19%) Banking
7 42 (10.19%) Marketing
8 34 (8.25%) Presentation Skills
9 28 (6.80%) Influencing Skills
10 19 (4.61%) Financial Institution
10 19 (4.61%) Manufacturing
11 13 (3.16%) Fire and Rescue
12 12 (2.91%) Front Office
13 9 (2.18%) Automotive
13 9 (2.18%) Public Sector
14 8 (1.94%) Electronics
15 7 (1.70%) Billing
16 6 (1.46%) Pharmaceutical
16 6 (1.46%) Retail
Job Titles
1 61 (14.81%) Architect
2 54 (13.11%) Lead
3 36 (8.74%) Consultant
3 36 (8.74%) Senior
4 26 (6.31%) Analyst
5 24 (5.83%) Applications Architect
5 24 (5.83%) IT Architect
6 22 (5.34%) Risk Manager
6 22 (5.34%) Security Consultant
7 21 (5.10%) Cybersecurity Consultant
7 21 (5.10%) Managing Consultant
8 19 (4.61%) Project Manager
9 14 (3.40%) Network Engineer
10 11 (2.67%) Cloud Architect
10 11 (2.67%) Lead Architect
10 11 (2.67%) Security Manager
11 10 (2.43%) Data Architect
11 10 (2.43%) Senior Manager
12 9 (2.18%) Applications Support
12 9 (2.18%) Senior Data Warehouse Specialist
Libraries, Frameworks & Software Standards
1 26 (6.31%) Kafka
2 9 (2.18%) .NET
2 9 (2.18%) Middleware
3 8 (1.94%) Elastic Stack
4 6 (1.46%) FHIR
5 4 (0.97%) CSS
5 4 (0.97%) HTML
6 3 (0.73%) ASP.NET
6 3 (0.73%) PySpark
7 2 (0.49%) AngularJS
7 2 (0.49%) Laravel
7 2 (0.49%) Lightning Web Components
7 2 (0.49%) Node.js
7 2 (0.49%) NumPy
7 2 (0.49%) Pandas
7 2 (0.49%) React
7 2 (0.49%) RESTful
7 2 (0.49%) Visualforce
8 1 (0.24%) Entity Framework
8 1 (0.24%) REST
Miscellaneous
1 77 (18.69%) Management Information System
2 28 (6.80%) Greenfield Project
3 25 (6.07%) Life Science
4 21 (5.10%) Security Posture
5 20 (4.85%) Cloud Native
6 19 (4.61%) SCADA
7 18 (4.37%) Onboarding
8 14 (3.40%) Data Structures
9 12 (2.91%) Data Centre
9 12 (2.91%) Hybrid Cloud
9 12 (2.91%) Product Ownership
9 12 (2.91%) Security Operations Centre
10 11 (2.67%) Legacy Systems
10 11 (2.67%) Social Media
11 10 (2.43%) Cyber Threat
11 10 (2.43%) LIMS
12 9 (2.18%) Market Risk
12 9 (2.18%) Self-Motivation
13 8 (1.94%) FMCG
14 6 (1.46%) NHS
Operating Systems
1 26 (6.31%) Windows
2 8 (1.94%) Windows Vista
3 5 (1.21%) Linux
4 2 (0.49%) Android
4 2 (0.49%) Apple iOS
4 2 (0.49%) VMS
5 1 (0.24%) Red Hat Enterprise Linux
5 1 (0.24%) Windows Server
Processes & Methodologies
1 128 (31.07%) Risk Management
2 117 (28.40%) Agile
3 104 (25.24%) Stakeholder Management
4 103 (25.00%) Continuous Improvement
5 100 (24.27%) Analytics
6 94 (22.82%) Problem-Solving
7 85 (20.63%) Data Governance
8 84 (20.39%) Stakeholder Engagement
9 75 (18.20%) Cybersecurity
10 74 (17.96%) Artificial Intelligence
10 74 (17.96%) Mentoring
11 62 (15.05%) Decision-Making
12 60 (14.56%) DevOps
13 58 (14.08%) Project Management
14 56 (13.59%) Migration
15 52 (12.62%) Coaching
16 51 (12.38%) Information Security
16 51 (12.38%) Roadmaps
17 49 (11.89%) Computer Science
17 49 (11.89%) Machine Learning
Programming Languages
1 43 (10.44%) SQL
2 30 (7.28%) Python
3 19 (4.61%) Java
4 9 (2.18%) PowerShell
5 8 (1.94%) R
6 5 (1.21%) JavaScript
7 4 (0.97%) Bicep
7 4 (0.97%) TypeScript
8 3 (0.73%) Bash
8 3 (0.73%) C#
8 3 (0.73%) Kotlin
9 2 (0.49%) Apex Code
9 2 (0.49%) C++
9 2 (0.49%) Go
9 2 (0.49%) PHP
10 1 (0.24%) C
10 1 (0.24%) Data Analysis Expressions
Qualifications
1 103 (25.00%) Degree
2 61 (14.81%) CISSP
3 50 (12.14%) CISM
4 34 (8.25%) Computer Science Degree
5 24 (5.83%) PMP
6 23 (5.58%) Master's Degree
6 23 (5.58%) PMI Certification
7 22 (5.34%) AWS Certification
8 20 (4.85%) CRISC
9 15 (3.64%) Security Cleared
10 14 (3.40%) SC Cleared
11 13 (3.16%) AWS Certified Solutions Architect
11 13 (3.16%) Azure Certification
12 10 (2.43%) CISA
13 9 (2.18%) DBS Check
14 7 (1.70%) CFA
14 7 (1.70%) GCIH
15 6 (1.46%) CompTIA Security+
15 6 (1.46%) ISO 27001 Lead Auditor
16 5 (1.21%) (ISC)2 CCSP
Quality Assurance & Compliance
1 85 (20.63%) GDPR
2 68 (16.50%) ISO/IEC 27001
3 39 (9.47%) NIST
4 27 (6.55%) Data Quality
5 25 (6.07%) QA
5 25 (6.07%) SOC 2
6 21 (5.10%) HIPAA
7 16 (3.88%) Sarbanes-Oxley
8 10 (2.43%) California Consumer Privacy Act
8 10 (2.43%) GLP
9 9 (2.18%) Cyber Essentials
10 8 (1.94%) GRC
11 7 (1.70%) Cyber Essentials PLUS
12 5 (1.21%) Accessibility
12 5 (1.21%) GxP
13 4 (0.97%) 21 CFR Part 11
13 4 (0.97%) Good Clinical Practice
13 4 (0.97%) ISO 22301
13 4 (0.97%) ISO 9001
13 4 (0.97%) PCI DSS
System Software
1 20 (4.85%) Active Directory
2 14 (3.40%) Docker
3 5 (1.21%) VMware Infrastructure
4 2 (0.49%) Virtual Desktop
5 1 (0.24%) Embedded Firmware
5 1 (0.24%) Firmware
5 1 (0.24%) Hyper-V
5 1 (0.24%) Terminal Server
5 1 (0.24%) Virtual Machines
Systems Management
1 24 (5.83%) Terraform
2 22 (5.34%) Kubernetes
3 11 (2.67%) Single Sign-On
4 9 (2.18%) Grafana
4 9 (2.18%) Prometheus
5 6 (1.46%) Ansible
6 4 (0.97%) Kubeflow
7 2 (0.49%) CSIRT
7 2 (0.49%) Rancher
7 2 (0.49%) vRealize
8 1 (0.24%) Computer Emergency Response Teams
8 1 (0.24%) Microsoft Intune
8 1 (0.24%) Nessus
8 1 (0.24%) Progress Chef
8 1 (0.24%) Puppet
Vendors
1 82 (19.90%) Microsoft
2 22 (5.34%) Google
3 12 (2.91%) SAP
4 10 (2.43%) Databricks
5 7 (1.70%) Facebook
5 7 (1.70%) Murex
5 7 (1.70%) VMware
6 6 (1.46%) Concur
6 6 (1.46%) Sage
7 5 (1.21%) Liquidlogic
7 5 (1.21%) ServiceNow
7 5 (1.21%) Tanium
8 4 (0.97%) Citrix
8 4 (0.97%) Salesforce
8 4 (0.97%) Workday
8 4 (0.97%) YouTube
9 3 (0.73%) Informatica
9 3 (0.73%) MuleSoft
9 3 (0.73%) Oracle
9 3 (0.73%) Siemens