Cloud Security Jobs

Cloud Security
UK

The table below provides summary statistics for permanent job vacancies requiring Cloud Security skills. It includes a benchmarking guide to the annual salaries offered in vacancies that cited Cloud Security over the 6 months leading up to 30 April 2025, comparing them to the same period in the previous two years.

6 months to
30 Apr 2025
Same period 2024 Same period 2023
Rank 258 320 164
Rank change year-on-year +62 -156 +128
Permanent jobs citing Cloud Security 595 881 2,361
As % of all permanent jobs advertised in the UK 1.14% 0.90% 2.27%
As % of the Processes & Methodologies category 1.22% 1.04% 2.37%
Number of salaries quoted 451 678 1,119
10th Percentile £45,000 £40,000 £42,874
25th Percentile £53,750 £47,000 £53,970
Median annual salary (50th Percentile) £70,000 £65,000 £73,000
Median % change year-on-year +7.69% -10.96% +1.39%
75th Percentile £88,750 £85,000 £93,750
90th Percentile £108,000 £100,000 £109,865
UK excluding London median annual salary £65,000 £57,007 £65,000
% change year-on-year +14.02% -12.30% +13.04%

All Process and Methodology Skills
UK

Cloud Security falls under the Processes and Methodologies category. For comparison with the information above, the following table provides summary statistics for all permanent job vacancies requiring process or methodology skills.

Permanent vacancies with a requirement for process or methodology skills 48,641 84,574 99,457
As % of all permanent jobs advertised in the UK 93.26% 86.00% 95.63%
Number of salaries quoted 26,531 59,798 58,397
10th Percentile £30,580 £29,000 £34,000
25th Percentile £42,500 £40,000 £45,000
Median annual salary (50th Percentile) £57,500 £55,000 £61,500
Median % change year-on-year +4.55% -10.57% +2.50%
75th Percentile £76,250 £72,500 £82,500
90th Percentile £98,750 £92,500 £100,000
UK excluding London median annual salary £52,500 £50,000 £55,000
% change year-on-year +5.00% -9.09% +4.76%

Cloud Security
Job Vacancy Trend

Job postings citing Cloud Security as a proportion of all IT jobs advertised.
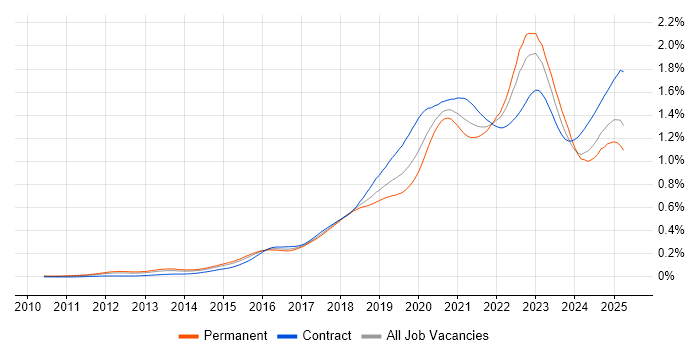
Job vacancy trend for Cloud Security in the UK

Cloud Security
Salary Trend

3-month moving average salary quoted in jobs citing Cloud Security.

Salary trend for Cloud Security in the UK

Cloud Security
Salary Histogram

Salary distribution for jobs citing Cloud Security over the 6 months to 30 April 2025.

Salary histogram for Cloud Security in the UK

Cloud Security
Top 18 Job Locations

The table below looks at the demand and provides a guide to the median salaries quoted in IT jobs citing Cloud Security within the UK over the 6 months to 30 April 2025. The 'Rank Change' column provides an indication of the change in demand within each location based on the same 6 month period last year.

Location Rank Change
on Same Period
Last Year
Matching
Permanent
IT Job Ads
Median Salary
Past 6 Months
Median Salary
% Change
on Same Period
Last Year
Live
Jobs
England +59 548 £70,000 +7.69% 525
UK excluding London +49 326 £65,000 +14.02% 327
Work from Home +89 241 £67,500 +3.85% 343
London +48 232 £82,500 +3.13% 283
North of England +13 101 £70,000 +33.33% 75
South East +92 88 £63,750 +27.50% 119
North West +11 64 £74,870 +49.74% 38
Midlands +33 45 £54,150 -16.69% 31
South West +56 41 £72,500 +21.80% 36
West Midlands +47 40 £53,300 -28.93% 20
Yorkshire +34 26 £52,500 -12.50% 29
East of England +65 23 £65,250 -10.00% 30
Scotland +106 18 £95,000 +59.59% 22
North East +33 11 £66,500 +56.47% 8
Northern Ireland +34 5 £110,000 +22.22% 16
East Midlands +26 5 £80,000 +33.33% 10
Wales +41 3 £75,000 +3.45% 7
Isle of Man +13 2 £34,500 -25.81% 2

Cloud Security
Co-occurring Skills and Capabilities by Category

The follow tables expand on the table above by listing co-occurrences grouped by category. The same employment type, locality and period is covered with up to 20 co-occurrences shown in each of the following categories:

Application Platforms
1 20 (3.36%) Microsoft Exchange
2 17 (2.86%) SharePoint
3 11 (1.85%) Apache Spark
4 6 (1.01%) Confluence
4 6 (1.01%) IIS
5 4 (0.67%) Apache
6 2 (0.34%) nginx
6 2 (0.34%) Oracle Workflow
7 1 (0.17%) Tomcat
Applications
1 4 (0.67%) Microsoft Office
1 4 (0.67%) MS Visio
2 3 (0.50%) Microsoft Project
2 3 (0.50%) Mozilla Thunderbird
3 2 (0.34%) Microsoft Excel
3 2 (0.34%) Oracle Smart View
3 2 (0.34%) Spreadsheet
4 1 (0.17%) Microsoft PowerPoint
Business Applications
1 2 (0.34%) Endur
1 2 (0.34%) Oracle Assets
1 2 (0.34%) Oracle Cash Management
1 2 (0.34%) Oracle ERP
1 2 (0.34%) Oracle Financials
1 2 (0.34%) Oracle General Ledger
1 2 (0.34%) Oracle Payables
1 2 (0.34%) Oracle Receivables
2 1 (0.17%) Dynamics CRM
2 1 (0.17%) SAP S/4HANA
Cloud Services
1 306 (51.43%) Azure
2 290 (48.74%) AWS
3 106 (17.82%) GCP
4 89 (14.96%) SaaS
5 65 (10.92%) Microsoft 365
6 57 (9.58%) Serverless
7 52 (8.74%) PaaS
8 41 (6.89%) Entra ID
9 39 (6.55%) AWS Lambda
10 37 (6.22%) IaaS
11 34 (5.71%) AWS CloudFormation
12 32 (5.38%) Azure DevOps
13 26 (4.37%) Amazon S3
14 25 (4.20%) Azure Sentinel
15 23 (3.87%) Virtual Private Cloud
16 20 (3.36%) Amazon EC2
16 20 (3.36%) AWS KMS
17 18 (3.03%) Power Platform
18 17 (2.86%) Microsoft Purview
19 15 (2.52%) GitHub
Communications & Networking
1 152 (25.55%) Firewall
2 97 (16.30%) Network Security
3 51 (8.57%) VPN
4 32 (5.38%) Intrusion Detection
5 28 (4.71%) WAN
6 25 (4.20%) DNS
7 18 (3.03%) SD-WAN
7 18 (3.03%) Wi-Fi
8 17 (2.86%) DHCP
9 16 (2.69%) LAN
9 16 (2.69%) Wireless
10 14 (2.35%) TCP/IP
11 13 (2.18%) BGP
12 12 (2.02%) MPLS
12 12 (2.02%) OSPF
12 12 (2.02%) WLAN
13 10 (1.68%) Cisco ASA
14 9 (1.51%) Cisco ISE
14 9 (1.51%) VLAN
15 8 (1.34%) SSL
Database & Business Intelligence
1 16 (2.69%) Amazon RDS
1 16 (2.69%) SQL Server
2 12 (2.02%) Big Data
3 11 (1.85%) Data Lake
4 10 (1.68%) MySQL
5 8 (1.34%) DynamoDB
5 8 (1.34%) Power BI
6 7 (1.18%) Amazon Redshift
7 6 (1.01%) PostgreSQL
8 5 (0.84%) Data Warehouse
8 5 (0.84%) MongoDB
9 4 (0.67%) Amazon Aurora
9 4 (0.67%) Delta Lake
10 3 (0.50%) Hadoop
10 3 (0.50%) NoSQL
11 2 (0.34%) Tableau
12 1 (0.17%) Azure SQL Database
12 1 (0.17%) Elasticsearch
12 1 (0.17%) Relational Database
12 1 (0.17%) SQL Server Reporting Services
Development Applications
1 34 (5.71%) Jenkins
2 32 (5.38%) Git
3 15 (2.52%) GitLab
4 7 (1.18%) JIRA
5 5 (0.84%) Cypress.io
5 5 (0.84%) Postman
5 5 (0.84%) Vite
5 5 (0.84%) webpack
6 4 (0.67%) JMeter
6 4 (0.67%) Locust
6 4 (0.67%) Robot Framework
6 4 (0.67%) Selenium
7 3 (0.50%) Bitbucket Server
7 3 (0.50%) CircleCI
7 3 (0.50%) Vagrant
8 2 (0.34%) Octopus Deploy
9 1 (0.17%) Bitbucket
9 1 (0.17%) Metasploit
9 1 (0.17%) SoapUI
9 1 (0.17%) Team Foundation Server
General
1 169 (28.40%) Social Skills
2 149 (25.04%) Finance
3 66 (11.09%) Law
4 60 (10.08%) Analytical Skills
5 28 (4.71%) Banking
6 27 (4.54%) Telecoms
7 25 (4.20%) Retail
8 21 (3.53%) Legal
8 21 (3.53%) Public Sector
9 20 (3.36%) Influencing Skills
10 19 (3.19%) Inclusion and Diversity
11 15 (2.52%) Presentation Skills
12 14 (2.35%) Marketing
13 12 (2.02%) Games
14 9 (1.51%) Manufacturing
15 8 (1.34%) Organisational Skills
16 7 (1.18%) Financial Institution
17 6 (1.01%) Back Office
18 5 (0.84%) Automotive
18 5 (0.84%) Aviation
Job Titles
1 157 (26.39%) Cloud Engineer
2 123 (20.67%) Security Engineer
3 116 (19.50%) Senior
4 110 (18.49%) Architect
5 68 (11.43%) Lead
6 67 (11.26%) Cloud Security Engineer
7 60 (10.08%) Security Architect
8 51 (8.57%) Senior Cloud Engineer
9 48 (8.07%) Cloud Architect
10 45 (7.56%) AWS Engineer
11 44 (7.39%) Infrastructure Engineer
12 41 (6.89%) Azure Engineer
13 40 (6.72%) Security Manager
14 37 (6.22%) AWS Architect
15 36 (6.05%) Analyst
16 28 (4.71%) Software Engineer
17 27 (4.54%) Senior Security Engineer
18 24 (4.03%) Security Analyst
19 20 (3.36%) Platform Engineer
19 20 (3.36%) Senior Software Engineer
Libraries, Frameworks & Software Standards
1 37 (6.22%) Node.js
2 23 (3.87%) Kafka
3 21 (3.53%) REST
4 20 (3.36%) Elastic Stack
5 17 (2.86%) Web Services
6 16 (2.69%) React
7 15 (2.52%) .NET
8 11 (1.85%) Azure Blueprints
9 10 (1.68%) YAML
10 9 (1.51%) AngularJS
11 8 (1.34%) ARM Templates
11 8 (1.34%) AWS CDK
11 8 (1.34%) OAuth
11 8 (1.34%) SAML
12 7 (1.18%) Next.js
12 7 (1.18%) Vue
13 6 (1.01%) 802.1X
14 5 (0.84%) OAuth2
14 5 (0.84%) Spring Boot
14 5 (0.84%) WebAssembly
Miscellaneous
1 128 (21.51%) Security Posture
2 109 (18.32%) Management Information System
3 66 (11.09%) Cloud Native
4 47 (7.90%) Public Cloud
5 45 (7.56%) Cloud Security Posture
6 30 (5.04%) Cyber Threat
6 30 (5.04%) Self-Motivation
7 25 (4.20%) Team-Oriented Environment
8 22 (3.70%) Data Centre
8 22 (3.70%) Hybrid Cloud
9 21 (3.53%) Social Media
10 18 (3.03%) Algorithms
11 16 (2.69%) PKI
12 15 (2.52%) Cyber Defence
13 14 (2.35%) Product Ownership
14 11 (1.85%) Enterprise Cloud
14 11 (1.85%) Security Operations Centre
15 9 (1.51%) Private Cloud
16 7 (1.18%) Cyber Security Posture
16 7 (1.18%) Video Conferencing
Operating Systems
1 94 (15.80%) Windows
2 57 (9.58%) Linux
3 26 (4.37%) Windows Server
4 21 (3.53%) Windows Vista
5 10 (1.68%) VMS
6 8 (1.34%) Apple iOS
6 8 (1.34%) Red Hat Enterprise Linux
7 7 (1.18%) Android
8 5 (0.84%) Windows Server 2016
9 4 (0.67%) Unix
10 3 (0.50%) Ubuntu
10 3 (0.50%) Windows Server 2019
11 2 (0.34%) Windows 10
12 1 (0.17%) Debian
12 1 (0.17%) Mac OS
12 1 (0.17%) Windows Server 2012
Processes & Methodologies
1 178 (29.92%) DevOps
2 176 (29.58%) Cybersecurity
3 151 (25.38%) CI/CD
4 139 (23.36%) Infrastructure as Code
5 121 (20.34%) Information Security
6 117 (19.66%) Incident Response
7 109 (18.32%) Problem-Solving
8 102 (17.14%) Vulnerability Management
9 101 (16.97%) Continuous Improvement
10 100 (16.81%) Security Architecture
11 95 (15.97%) Risk Management
12 94 (15.80%) Computer Science
13 91 (15.29%) Roadmaps
14 89 (14.96%) SIEM
15 88 (14.79%) Agile
16 77 (12.94%) Data Protection
17 75 (12.61%) Security Operations
18 73 (12.27%) DevSecOps
19 72 (12.10%) Software Engineering
20 69 (11.60%) Containerisation
Programming Languages
1 156 (26.22%) Python
2 64 (10.76%) PowerShell
3 48 (8.07%) Java
4 38 (6.39%) Bash
5 33 (5.55%) TypeScript
6 29 (4.87%) SQL
7 22 (3.70%) Go
8 14 (2.35%) Bicep
8 14 (2.35%) JavaScript
9 8 (1.34%) C#
10 4 (0.67%) Perl
10 4 (0.67%) Ruby
10 4 (0.67%) Rust
11 3 (0.50%) C++
11 3 (0.50%) Groovy
11 3 (0.50%) Kusto Query Language
11 3 (0.50%) R
11 3 (0.50%) Shell Script
12 2 (0.34%) PHP
12 2 (0.34%) Scala
Qualifications
1 123 (20.67%) CISSP
2 117 (19.66%) Degree
3 78 (13.11%) CISM
4 75 (12.61%) Security Cleared
5 71 (11.93%) AWS Certification
6 67 (11.26%) SC Cleared
7 61 (10.25%) Computer Science Degree
8 51 (8.57%) Cisco Certification
9 48 (8.07%) (ISC)2 CCSP
10 43 (7.23%) CISA
11 38 (6.39%) Azure Certification
12 34 (5.71%) AWS Certified Solutions Architect
12 34 (5.71%) CEH
13 28 (4.71%) Master's Degree
14 22 (3.70%) DBS Check
15 20 (3.36%) AWS Certified Cloud Practitioner
15 20 (3.36%) CCSP
16 19 (3.19%) Microsoft Certification
17 13 (2.18%) CCSK
17 13 (2.18%) DV Cleared
Quality Assurance & Compliance
1 125 (21.01%) NIST
2 120 (20.17%) ISO/IEC 27001
3 110 (18.49%) GDPR
4 45 (7.56%) PCI DSS
5 29 (4.87%) HIPAA
6 26 (4.37%) Accessibility
7 23 (3.87%) Cyber Essentials
8 21 (3.53%) SOC 2
9 19 (3.19%) GRC
10 18 (3.03%) Cyber Essentials PLUS
10 18 (3.03%) NCSC
11 16 (2.69%) Sarbanes-Oxley
12 9 (1.51%) SLA
13 7 (1.18%) QA
14 5 (0.84%) California Consumer Privacy Act
14 5 (0.84%) COBIT
15 4 (0.67%) Actionable Recommendations
15 4 (0.67%) NIST 800
16 3 (0.50%) ISO/IEC 27002 (supersedes ISO/IEC 17799)
17 2 (0.34%) ISO/IEC 27005
System Software
1 64 (10.76%) Docker
2 51 (8.57%) Active Directory
3 19 (3.19%) VMware Infrastructure
4 18 (3.03%) Virtual Machines
5 11 (1.85%) Hyper-V
6 7 (1.18%) VMware ESXi
7 4 (0.67%) Firmware
7 4 (0.67%) Virtual Desktop
8 2 (0.34%) vSphere
9 1 (0.17%) VMware Server
Systems Management
1 146 (24.54%) Terraform
2 123 (20.67%) Kubernetes
3 47 (7.90%) Ansible
4 26 (4.37%) CASB
5 25 (4.20%) Microsoft Intune
6 22 (3.70%) Grafana
6 22 (3.70%) Prometheus
7 11 (1.85%) Progress Chef
7 11 (1.85%) Single Sign-On
8 10 (1.68%) QRadar
9 9 (1.51%) SCCM
10 7 (1.18%) Active Directory Federation Services
10 7 (1.18%) Istio
11 6 (1.01%) Nessus
12 5 (0.84%) ArcSight ESM
12 5 (0.84%) linkerd
13 4 (0.67%) HP Fortify
13 4 (0.67%) ZENworks
14 3 (0.50%) Jamf Pro
14 3 (0.50%) Nagios
Vendors
1 161 (27.06%) Microsoft
2 56 (9.41%) Google
3 38 (6.39%) Cisco
4 25 (4.20%) VMware
5 21 (3.53%) Splunk
6 18 (3.03%) Meraki
6 18 (3.03%) Ping Identity
7 17 (2.86%) SolarWinds
8 12 (2.02%) Juniper
9 11 (1.85%) ServiceNow
10 10 (1.68%) IBM
11 9 (1.51%) CheckPoint
11 9 (1.51%) Databricks
11 9 (1.51%) Palo Alto
11 9 (1.51%) Zscaler
12 8 (1.34%) Dynatrace
13 7 (1.18%) LogicMonitor
13 7 (1.18%) Veeam
14 6 (1.01%) Dell
14 6 (1.01%) Riverbed