Acceptance Criteria Jobs with Work from Home Options

Acceptance Criteria
UK > Work from Home

The table below provides summary statistics for permanent job vacancies with an option to work from home (WFH) and a requirement for Acceptance Criteria skills. Included is a benchmarking guide to the salaries offered in vacancies that have cited Acceptance Criteria over the 6 months to 11 May 2024 with a comparison to the same period in the previous 2 years.

6 months to
11 May 2024
Same period 2023 Same period 2022
Rank 423 377 254
Rank change year-on-year -46 -123 +145
Permanent jobs citing Acceptance Criteria 165 326 1,049
As % of all permanent jobs with a WFH option 0.49% 0.79% 1.53%
As % of the Processes & Methodologies category 0.53% 0.82% 1.57%
Number of salaries quoted 119 222 548
10th Percentile £33,750 £35,250 £38,712
25th Percentile £42,500 £46,250 £45,750
Median annual salary (50th Percentile) £52,500 £55,000 £57,250
Median % change year-on-year -4.55% -3.93% +11.71%
75th Percentile £62,500 £61,250 £68,750
90th Percentile £68,000 £77,715 £80,075
UK median annual salary £57,500 £56,549 £57,500
% change year-on-year +1.68% -1.65% +9.52%

All Process and Methodology Skills
Work from Home

Acceptance Criteria is in the Processes and Methodologies category. The following table is for comparison with the above and provides summary statistics for all permanent job vacancies with a WFH option and a requirement for process or methodology skills.

Permanent vacancies with a requirement for process or methodology skills 30,884 39,545 66,696
As % of all permanent jobs with a WFH option 91.37% 96.08% 96.99%
Number of salaries quoted 23,455 27,516 41,159
10th Percentile £33,750 £37,500 £36,250
25th Percentile £42,500 £47,500 £45,750
Median annual salary (50th Percentile) £57,500 £62,500 £60,000
Median % change year-on-year -8.00% +4.17% +9.09%
75th Percentile £75,000 £82,500 £80,000
90th Percentile £95,000 £100,000 £95,000
UK median annual salary £55,000 £61,000 £60,000
% change year-on-year -9.84% +1.67% +9.09%

Acceptance Criteria
Trend for Jobs with a WFH Option

Job vacancies with a work from home option citing Acceptance Criteria as a proportion of all IT jobs advertised.
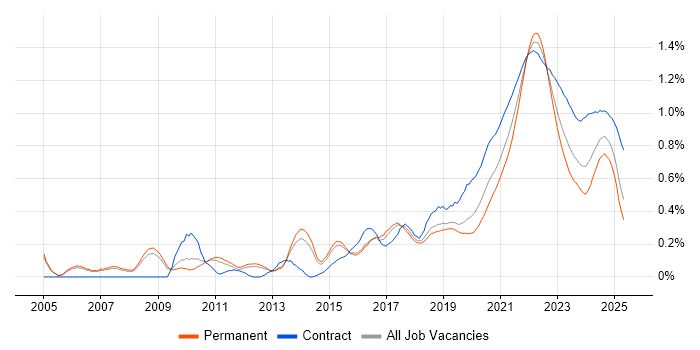
Acceptance Criteria trend for jobs with a WFH option

Acceptance Criteria
Salary Trend for Jobs with a WFH Option

3-month moving average salary quoted in job vacancies with a work from home option citing Acceptance Criteria.

Acceptance Criteria salary trend for jobs with a WFH option

Acceptance Criteria
Salary Histogram for Jobs with a WFH Option

Salary distribution for jobs with a work from home option citing Acceptance Criteria over the 6 months to 11 May 2024.

Acceptance Criteria salary histogram for jobs with a WFH option

Acceptance Criteria
Co-occurring Skills and Capabilities with WFH Options by Category

The follow tables expand on the table above by listing co-occurrences grouped by category. The same employment type, locality and period is covered with up to 20 co-occurrences shown in each of the following categories:

Application Platforms
1 19 (11.52%) Confluence
2 3 (1.82%) Apache Spark
2 3 (1.82%) SharePoint
3 1 (0.61%) Adobe Experience Manager
3 1 (0.61%) Apache Solr
3 1 (0.61%) CMS
3 1 (0.61%) Sitecore CMS
3 1 (0.61%) Umbraco
3 1 (0.61%) WordPress
Applications
1 4 (2.42%) Microsoft Excel
2 3 (1.82%) Trello
3 2 (1.21%) Microsoft PowerPoint
4 1 (0.61%) Microsoft Office
4 1 (0.61%) MS Visio
Business Applications
1 1 (0.61%) Dynamics CRM
1 1 (0.61%) Elite 3E
Cloud Services
1 34 (20.61%) Azure
2 27 (16.36%) SaaS
3 17 (10.30%) AWS
4 15 (9.09%) Azure DevOps
5 8 (4.85%) Power Platform
6 5 (3.03%) Azure Data Factory
6 5 (3.03%) BrowserStack
7 4 (2.42%) Azure Synapse Analytics
7 4 (2.42%) WhatsApp
8 3 (1.82%) Dynamics 365
8 3 (1.82%) GitHub
8 3 (1.82%) Microsoft 365
9 2 (1.21%) Azure Functions
9 2 (1.21%) Entra ID
9 2 (1.21%) IaaS
9 2 (1.21%) OneDrive
9 2 (1.21%) PaaS
9 2 (1.21%) Serverless
10 1 (0.61%) Asana
10 1 (0.61%) GCP
Communications & Networking
1 10 (6.06%) Broadband
1 10 (6.06%) Internet
1 10 (6.06%) WPA
2 3 (1.82%) HTTP
3 2 (1.21%) Cisco IOS
3 2 (1.21%) Intrusion Detection
3 2 (1.21%) VPN
3 2 (1.21%) Wireless
4 1 (0.61%) AMQP
Database & Business Intelligence
1 9 (5.45%) Data Warehouse
2 6 (3.64%) Power BI
3 5 (3.03%) Data Lake
4 4 (2.42%) Big Data
4 4 (2.42%) Hadoop
4 4 (2.42%) HDInsight
4 4 (2.42%) Looker
4 4 (2.42%) NoSQL
4 4 (2.42%) QlikView
4 4 (2.42%) Relational Database
4 4 (2.42%) Tableau
5 3 (1.82%) Apache Hive
5 3 (1.82%) GIS
5 3 (1.82%) Neo4j
6 2 (1.21%) SQL Server
7 1 (0.61%) Apache Accumulo
7 1 (0.61%) Azure SQL Data Warehouse
7 1 (0.61%) Metadata
7 1 (0.61%) SAP BW
Development Applications
1 37 (22.42%) JIRA
2 14 (8.48%) Git
3 13 (7.88%) Postman
4 10 (6.06%) Cypress.io
4 10 (6.06%) Selenium
5 7 (4.24%) SpecFlow
5 7 (4.24%) Team Foundation Server
6 5 (3.03%) JMeter
6 5 (3.03%) Visual Studio
6 5 (3.03%) Visual Studio Team System
7 3 (1.82%) Cucumber
7 3 (1.82%) WebDriver
8 2 (1.21%) Appium
8 2 (1.21%) GitLab
8 2 (1.21%) TeamCity
9 1 (0.61%) Zephyr
General
1 42 (25.45%) Social Skills
2 32 (19.39%) Finance
3 21 (12.73%) Analytical Skills
3 21 (12.73%) Retail
4 19 (11.52%) Marketing
5 12 (7.27%) Public Sector
6 11 (6.67%) Inclusion and Diversity
7 7 (4.24%) Games
8 6 (3.64%) Legal
9 5 (3.03%) Retail Finance
10 4 (2.42%) Manufacturing
10 4 (2.42%) Presentation Skills
11 3 (1.82%) Automotive
11 3 (1.82%) Documentation Skills
11 3 (1.82%) Organisational Skills
12 2 (1.21%) Digital Health
12 2 (1.21%) Digital Healthcare
12 2 (1.21%) Health Technology
12 2 (1.21%) Law
12 2 (1.21%) Social Housing
Job Titles
1 47 (28.48%) Analyst
2 34 (20.61%) Business Analyst
3 31 (18.79%) Product Manager
4 27 (16.36%) Product Owner
5 23 (13.94%) Senior
6 13 (7.88%) Senior Analyst
6 13 (7.88%) Senior Business Analyst
7 12 (7.27%) Developer
7 12 (7.27%) QA Engineer
8 10 (6.06%) Tester
9 7 (4.24%) Digital Product Owner
10 6 (3.64%) Data Manager
10 6 (3.64%) Lead
10 6 (3.64%) QA Analyst
10 6 (3.64%) Senior QA Engineer
11 5 (3.03%) Full Stack Developer
11 5 (3.03%) Test Analyst
12 4 (2.42%) Software Engineer
12 4 (2.42%) Software Tester
12 4 (2.42%) Technical Product Owner
Libraries, Frameworks & Software Standards
1 19 (11.52%) .NET
2 13 (7.88%) Lightning Web Components
3 11 (6.67%) HTML
4 9 (5.45%) CSS
4 9 (5.45%) Vue
5 8 (4.85%) REST
6 7 (4.24%) .NET Core
6 7 (4.24%) HTML5
6 7 (4.24%) XML
7 6 (3.64%) Node.js
7 6 (3.64%) RESTful
8 5 (3.03%) .NET Framework
8 5 (3.03%) JSON
8 5 (3.03%) Nightwatchjs
9 4 (2.42%) ASP.NET MVC
9 4 (2.42%) Express.js
9 4 (2.42%) React
9 4 (2.42%) Svelte
9 4 (2.42%) Web Services
9 4 (2.42%) YAML
Miscellaneous
1 65 (39.39%) Product Ownership
2 27 (16.36%) NHS
3 13 (7.88%) Mobile App
4 5 (3.03%) Replication
5 4 (2.42%) Algorithms
5 4 (2.42%) Cloud Native
5 4 (2.42%) Data Structures
5 4 (2.42%) Greenfield Project
5 4 (2.42%) PMI
6 3 (1.82%) Management Information System
7 2 (1.21%) Analytical Mindset
7 2 (1.21%) BYOD
7 2 (1.21%) Educational Technology
7 2 (1.21%) Enterprise Cloud
7 2 (1.21%) Hedge funds
7 2 (1.21%) Onboarding
7 2 (1.21%) Operational Technology
8 1 (0.61%) Enterprise Software
8 1 (0.61%) Public Cloud
8 1 (0.61%) Renewable Energy
Operating Systems
1 9 (5.45%) Android
1 9 (5.45%) Apple iOS
1 9 (5.45%) Windows
2 3 (1.82%) Linux
Processes & Methodologies
1 109 (66.06%) User Stories
2 105 (63.64%) Agile
3 53 (32.12%) Roadmaps
4 39 (23.64%) Scrum
5 35 (21.21%) Test Automation
6 30 (18.18%) Product Roadmap
7 28 (16.97%) Problem-Solving
8 24 (14.55%) Product Strategy
9 23 (13.94%) Product Requirements
10 22 (13.33%) User Experience
11 21 (12.73%) DevOps
12 20 (12.12%) Product Backlog
13 19 (11.52%) Continuous Improvement
13 19 (11.52%) Requirements Gathering
14 18 (10.91%) Epics
14 18 (10.91%) Market Research
14 18 (10.91%) Test Scripting
14 18 (10.91%) Use Case
14 18 (10.91%) Workshop Facilitation
15 17 (10.30%) Backlog Management
Programming Languages
1 28 (16.97%) JavaScript
1 28 (16.97%) SQL
2 19 (11.52%) C#
3 16 (9.70%) TypeScript
4 13 (7.88%) Python
5 6 (3.64%) Java
6 5 (3.03%) C++
6 5 (3.03%) R
7 4 (2.42%) PowerShell
8 3 (1.82%) Apex Code
9 2 (1.21%) Tcl
9 2 (1.21%) T-SQL
Qualifications
1 13 (7.88%) Degree
2 8 (4.85%) Security Cleared
3 5 (3.03%) BPSS Clearance
4 4 (2.42%) PMI Certification
5 2 (1.21%) CSPO
5 2 (1.21%) DV Cleared
5 2 (1.21%) ISEB
5 2 (1.21%) Master's Degree
5 2 (1.21%) MBA
6 1 (0.61%) DBS Check
6 1 (0.61%) ISEB Practitioner
6 1 (0.61%) ISTQB
6 1 (0.61%) ISTQB Foundation Certification
6 1 (0.61%) SC Cleared
Quality Assurance & Compliance
1 47 (28.48%) QA
2 7 (4.24%) GDPR
3 6 (3.64%) Accessibility
4 4 (2.42%) California Consumer Privacy Act
5 2 (1.21%) Data Quality
6 1 (0.61%) PMO
System Software
1 2 (1.21%) Active Directory
2 1 (0.61%) Firmware
Systems Management
1 5 (3.03%) Grafana
1 5 (3.03%) Kibana
2 2 (1.21%) Microsoft Intune
2 2 (1.21%) Terraform
3 1 (0.61%) Kubernetes
Vendors
1 15 (9.09%) Salesforce
2 11 (6.67%) Microsoft
3 4 (2.42%) Databricks
4 2 (1.21%) Adobe
4 2 (1.21%) Apple
4 2 (1.21%) Cisco
4 2 (1.21%) Xamarin
5 1 (0.61%) Marketo
5 1 (0.61%) Mercator
5 1 (0.61%) Oracle
5 1 (0.61%) SAP
5 1 (0.61%) Sitecore
5 1 (0.61%) Sophis
5 1 (0.61%) Talend