OAuth Jobs with Work from Home Options

OAuth
UK > Work from Home

The table below provides summary statistics for permanent job vacancies with an option to work from home (WFH) and a requirement for OAuth skills. Included is a benchmarking guide to the salaries offered in vacancies that have cited OAuth over the 6 months to 6 May 2024 with a comparison to the same period in the previous 2 years.

6 months to
6 May 2024
Same period 2023 Same period 2022
Rank 479 528 452
Rank change year-on-year +49 -76 -20
Permanent jobs citing OAuth 104 134 456
As % of all permanent jobs with a WFH option 0.31% 0.32% 0.67%
As % of the Libraries, Frameworks & Software Standards category 1.16% 0.93% 1.48%
Number of salaries quoted 91 80 231
10th Percentile £47,500 £55,000 £42,500
25th Percentile £51,250 £58,769 £46,250
Median annual salary (50th Percentile) £61,000 £75,000 £62,500
Median % change year-on-year -18.67% +20.00% -3.85%
75th Percentile £78,750 £86,563 £80,000
90th Percentile £93,750 £97,500 £90,000
UK median annual salary £60,000 £80,000 £62,500
% change year-on-year -25.00% +28.00% -7.41%

All Software Libraries and Frameworks
Work from Home

OAuth is in the Software Libraries and Frameworks category. The following table is for comparison with the above and provides summary statistics for all permanent job vacancies with a WFH option and a requirement for technical specification, industry standards, software libraries and framework skills.

Permanent vacancies with a requirement for technical specification, industry standards, software libraries and framework skills 8,992 14,346 30,737
As % of all permanent jobs with a WFH option 26.56% 33.85% 44.94%
Number of salaries quoted 7,530 10,779 17,270
10th Percentile £38,750 £41,250 £38,750
25th Percentile £47,500 £50,677 £46,625
Median annual salary (50th Percentile) £60,000 £65,000 £62,500
Median % change year-on-year -7.69% +4.00% +13.64%
75th Percentile £79,500 £86,250 £81,250
90th Percentile £100,000 £102,500 £95,000
UK median annual salary £60,000 £67,500 £63,000
% change year-on-year -11.11% +7.14% +14.55%

OAuth
Trend for Jobs with a WFH Option

Job vacancies with a work from home option citing OAuth as a proportion of all IT jobs advertised.
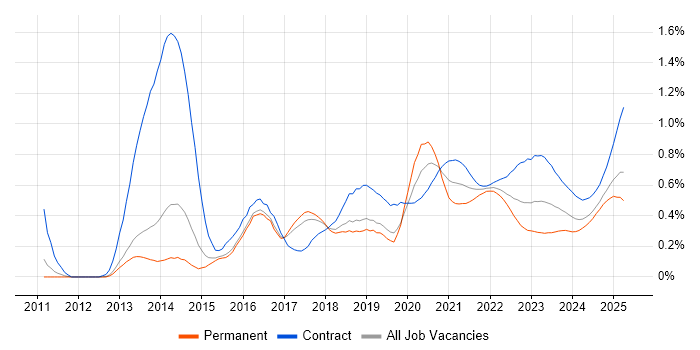
OAuth trend for jobs with a WFH option

OAuth
Salary Trend for Jobs with a WFH Option

3-month moving average salary quoted in job vacancies with a work from home option citing OAuth.

OAuth salary trend for jobs with a WFH option

OAuth
Salary Histogram for Jobs with a WFH Option

Salary distribution for jobs with a work from home option citing OAuth over the 6 months to 6 May 2024.

OAuth salary histogram for jobs with a WFH option

OAuth
Co-occurring Skills and Capabilities with WFH Options by Category

The follow tables expand on the table above by listing co-occurrences grouped by category. The same employment type, locality and period is covered with up to 20 co-occurrences shown in each of the following categories:

Application Platforms
1 8 (7.69%) SharePoint
2 6 (5.77%) nginx
3 2 (1.92%) CMS
4 1 (0.96%) Confluence
4 1 (0.96%) SAS
Cloud Services
1 69 (66.35%) Azure
2 58 (55.77%) AWS
3 17 (16.35%) SaaS
4 13 (12.50%) GCP
5 10 (9.62%) Entra ID
5 10 (9.62%) Serverless
6 9 (8.65%) Azure Service Bus
7 7 (6.73%) Microsoft 365
8 6 (5.77%) Dynamics 365
8 6 (5.77%) npm
8 6 (5.77%) Yarn
9 5 (4.81%) Azure DevOps
10 4 (3.85%) Amazon S3
10 4 (3.85%) AWS Lambda
11 3 (2.88%) Amazon OpenSearch
11 3 (2.88%) Azure Storage
11 3 (2.88%) Cloud Computing
12 2 (1.92%) Amazon GuardDuty
12 2 (1.92%) AWS Control Tower
12 2 (1.92%) Boomi
Communications & Networking
1 16 (15.38%) DNS
1 16 (15.38%) Firewall
2 6 (5.77%) AMQP
3 2 (1.92%) SAN
3 2 (1.92%) Wireless
4 1 (0.96%) LAN
4 1 (0.96%) Network Security
4 1 (0.96%) SD-WAN
4 1 (0.96%) VLAN
4 1 (0.96%) WAN
Database & Business Intelligence
1 15 (14.42%) Relational Database
2 12 (11.54%) MongoDB
3 6 (5.77%) Data Warehouse
4 4 (3.85%) DynamoDB
4 4 (3.85%) InfluxDB
4 4 (3.85%) NoSQL
4 4 (3.85%) PostgreSQL
5 3 (2.88%) Azure SQL Database
5 3 (2.88%) Elasticsearch
5 3 (2.88%) Redis
5 3 (2.88%) SQL Server
6 1 (0.96%) MySQL
6 1 (0.96%) Power BI
6 1 (0.96%) SQL Server Integration Services
6 1 (0.96%) SQL Server Reporting Services
Development Applications
1 18 (17.31%) Git
2 6 (5.77%) Cypress.io
2 6 (5.77%) Mocha
3 4 (3.85%) Jenkins
3 4 (3.85%) JMeter
3 4 (3.85%) Postman
3 4 (3.85%) SoapUI
4 1 (0.96%) JIRA
General
1 23 (22.12%) Social Skills
2 14 (13.46%) Finance
3 9 (8.65%) Law
4 4 (3.85%) Analytical Skills
4 4 (3.85%) Presentation Skills
4 4 (3.85%) Welsh Language
5 3 (2.88%) Pharmaceutical
6 1 (0.96%) Legal
6 1 (0.96%) Tech for Good
Job Titles
1 68 (65.38%) Developer
2 30 (28.85%) Senior
3 22 (21.15%) Full Stack Developer
3 22 (21.15%) Senior Developer
4 19 (18.27%) .NET Developer
5 17 (16.35%) Architect
6 15 (14.42%) Backend Developer
7 11 (10.58%) DevOps Developer
8 10 (9.62%) Django Developer
8 10 (9.62%) Full Stack PHP Developer
8 10 (9.62%) Mid-Level PHP Developer
8 10 (9.62%) PHP Developer
8 10 (9.62%) PHP Laravel Developer
8 10 (9.62%) Python Developer
8 10 (9.62%) Python/Django Developer
9 9 (8.65%) Lead
10 8 (7.69%) Full Stack .NET Developer
10 8 (7.69%) Senior .NET Developer
10 8 (7.69%) Senior Full Stack Developer
11 7 (6.73%) C# Developer
Libraries, Frameworks & Software Standards
1 48 (46.15%) OpenID
2 44 (42.31%) .NET
3 37 (35.58%) CSS
3 37 (35.58%) HTML
4 32 (30.77%) React
5 31 (29.81%) SAML
6 30 (28.85%) REST
7 28 (26.92%) RESTful
8 24 (23.08%) AngularJS
9 21 (20.19%) Microsoft Graph
10 19 (18.27%) JSON
11 17 (16.35%) OpenAPI
12 15 (14.42%) ASP.NET
12 15 (14.42%) Vue
13 14 (13.46%) Express.js
13 14 (13.46%) jQuery
13 14 (13.46%) JWT
13 14 (13.46%) Laravel
13 14 (13.46%) Node.js
14 13 (12.50%) Django
Miscellaneous
1 16 (15.38%) Product Ownership
2 13 (12.50%) Data Structures
3 8 (7.69%) Greenfield Project
3 8 (7.69%) Onboarding
4 4 (3.85%) PKI
4 4 (3.85%) Security Posture
5 3 (2.88%) Client/Server
5 3 (2.88%) Management Information System
6 2 (1.92%) Enterprise Software
6 2 (1.92%) IoT
6 2 (1.92%) Mobile App
6 2 (1.92%) Public Cloud
6 2 (1.92%) Robotics
7 1 (0.96%) Low-Code
Operating Systems
1 15 (14.42%) Linux
2 4 (3.85%) Android
2 4 (3.85%) Apple iOS
2 4 (3.85%) Unix
3 1 (0.96%) Windows
3 1 (0.96%) Windows Server
Processes & Methodologies
1 66 (63.46%) Agile
2 45 (43.27%) DevOps
3 38 (36.54%) TDD
4 33 (31.73%) Software Engineering
5 31 (29.81%) Scrum
6 30 (28.85%) Microservices
7 27 (25.96%) Problem-Solving
8 23 (22.12%) BDD
9 22 (21.15%) Full Stack Development
9 22 (21.15%) Identity Access Management
10 20 (19.23%) Design Patterns
11 19 (18.27%) Test Automation
12 18 (17.31%) CI/CD
12 18 (17.31%) Kanban
13 17 (16.35%) Cybersecurity
13 17 (16.35%) DevSecOps
13 17 (16.35%) Fintech
13 17 (16.35%) Risk Management
14 15 (14.42%) OOP
14 15 (14.42%) SDLC
Programming Languages
1 42 (40.38%) C#
2 39 (37.50%) Java
3 37 (35.58%) JavaScript
4 29 (27.88%) Python
5 21 (20.19%) SQL
6 16 (15.38%) PHP
7 15 (14.42%) TypeScript
8 12 (11.54%) Go
9 8 (7.69%) Kotlin
10 6 (5.77%) PowerShell
11 4 (3.85%) Groovy
11 4 (3.85%) Lua
11 4 (3.85%) Ruby
11 4 (3.85%) Rust
12 2 (1.92%) Apex Code
12 2 (1.92%) Dart
12 2 (1.92%) Objective-C
12 2 (1.92%) Swift
Qualifications
1 23 (22.12%) Security Cleared
2 19 (18.27%) SC Cleared
3 12 (11.54%) Azure Certification
4 8 (7.69%) BPSS Clearance
4 8 (7.69%) Degree
5 4 (3.85%) GIAC
5 4 (3.85%) ISTQB
6 3 (2.88%) Computer Science Degree
7 1 (0.96%) CCNP
7 1 (0.96%) Cisco Certification
7 1 (0.96%) Microsoft Certification
Quality Assurance & Compliance
1 14 (13.46%) QA
2 12 (11.54%) Accessibility
3 9 (8.65%) ISO/IEC 27001
4 6 (5.77%) Cyber Essentials
5 2 (1.92%) SOC 2
System Software
1 25 (24.04%) Docker
2 18 (17.31%) Active Directory
3 15 (14.42%) Virtual Servers
4 2 (1.92%) Virtual Machines
5 1 (0.96%) Hyper-V
5 1 (0.96%) VMware Infrastructure
5 1 (0.96%) vSphere
Systems Management
1 10 (9.62%) Grafana
2 9 (8.65%) Kubernetes
3 7 (6.73%) Single Sign-On
4 6 (5.77%) Prometheus
5 1 (0.96%) Microsoft Intune
5 1 (0.96%) vCenter Server
Vendors
1 31 (29.81%) Microsoft
2 16 (15.38%) Google
3 5 (4.81%) Oracle
4 4 (3.85%) ForgeRock
5 2 (1.92%) Dell
5 2 (1.92%) MuleSoft
5 2 (1.92%) Salesforce
5 2 (1.92%) Xamarin
6 1 (0.96%) Atlassian
6 1 (0.96%) Cisco
6 1 (0.96%) Citrix
6 1 (0.96%) Databricks
6 1 (0.96%) EMC
6 1 (0.96%) Juniper
6 1 (0.96%) Okta
6 1 (0.96%) Palo Alto
6 1 (0.96%) SolarWinds
6 1 (0.96%) VMware
6 1 (0.96%) Zscaler