Cypress.io Jobs with Work from Home Options

Cypress.io
UK > Work from Home

The table below provides summary statistics for permanent job vacancies with an option to work from home (WFH) and a requirement for Cypress.io skills. Included is a benchmarking guide to the salaries offered in vacancies that have cited Cypress.io over the 6 months to 28 April 2024 with a comparison to the same period in the previous 2 years.

6 months to
28 Apr 2024
Same period 2023 Same period 2022
Rank 462 372 239
Rank change year-on-year -90 -133 +68
Permanent jobs citing Cypress.io 124 329 1,099
As % of all permanent jobs with a WFH option 0.37% 0.77% 1.64%
As % of the Development Applications category 3.17% 5.00% 6.95%
Number of salaries quoted 110 282 444
10th Percentile £42,500 £43,075 £41,250
25th Percentile £47,500 £52,500 £45,000
Median annual salary (50th Percentile) £65,000 £65,000 £60,000
Median % change year-on-year - +8.33% +4.35%
75th Percentile £95,000 £86,625 £75,000
90th Percentile £112,500 £100,000 £85,000
UK median annual salary £73,750 £65,000 £62,500
% change year-on-year +13.46% +4.00% +4.17%

All Development Application Skills
Work from Home

Cypress.io is in the Development Applications category. The following table is for comparison with the above and provides summary statistics for all permanent job vacancies with a WFH option and a requirement for development application skills.

Permanent vacancies with a requirement for development application skills 3,917 6,582 15,807
As % of all permanent jobs with a WFH option 11.60% 15.38% 23.63%
Number of salaries quoted 3,033 4,680 8,358
10th Percentile £37,500 £41,250 £37,500
25th Percentile £46,250 £50,000 £45,000
Median annual salary (50th Percentile) £60,000 £64,472 £60,000
Median % change year-on-year -6.94% +7.45% +9.09%
75th Percentile £76,250 £80,000 £77,500
90th Percentile £91,934 £95,000 £91,250
UK median annual salary £60,000 £65,000 £62,500
% change year-on-year -7.69% +4.00% +9.65%

Cypress.io
Trend for Jobs with a WFH Option

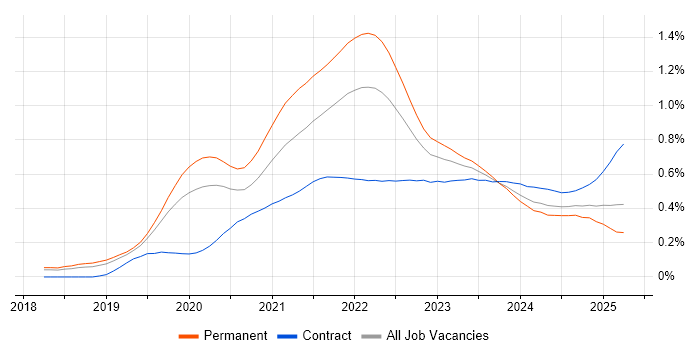
Job vacancies with a work from home option citing Cypress.io as a proportion of all IT jobs advertised.

Cypress.io trend for jobs with a WFH option

Cypress.io
Salary Trend for Jobs with a WFH Option

3-month moving average salary quoted in job vacancies with a work from home option citing Cypress.io.

Cypress.io salary trend for jobs with a WFH option

Cypress.io
Salary Histogram for Jobs with a WFH Option

Salary distribution for jobs with a work from home option citing Cypress.io over the 6 months to 28 April 2024.

Cypress.io salary histogram for jobs with a WFH option

Cypress.io
Co-occurring Skills and Capabilities with WFH Options by Category

The follow tables expand on the table above by listing co-occurrences grouped by category. The same employment type, locality and period is covered with up to 20 co-occurrences shown in each of the following categories:

Application Platforms
1 6 (4.84%) nginx
2 4 (3.23%) Adobe Experience Manager
3 1 (0.81%) Confluence
3 1 (0.81%) WordPress
Cloud Services
1 50 (40.32%) Azure
2 38 (30.65%) AWS
3 30 (24.19%) SaaS
4 18 (14.52%) GCP
5 11 (8.87%) Azure DevOps
6 10 (8.06%) GitHub
7 8 (6.45%) BrowserStack
7 8 (6.45%) npm
8 7 (5.65%) Serverless
9 6 (4.84%) Firebase
9 6 (4.84%) Yarn
10 5 (4.03%) Sauce Labs
11 3 (2.42%) BlazeMeter
11 3 (2.42%) Cloud Computing
11 3 (2.42%) OpenShift
12 2 (1.61%) Azure Pipelines
13 1 (0.81%) Amazon EC2
13 1 (0.81%) Amazon ECS
13 1 (0.81%) Amazon S3
13 1 (0.81%) Azure Stack
Communications & Networking
1 6 (4.84%) AMQP
2 2 (1.61%) HTTP
2 2 (1.61%) Internet
Database & Business Intelligence
1 10 (8.06%) MongoDB
2 7 (5.65%) Relational Database
3 3 (2.42%) Elasticsearch
3 3 (2.42%) PostgreSQL
4 1 (0.81%) Amazon RDS
4 1 (0.81%) Electronic Patient Records
4 1 (0.81%) Neo4j
4 1 (0.81%) NoSQL
4 1 (0.81%) RDBMS
Development Applications
1 40 (32.26%) Postman
1 40 (32.26%) Selenium
2 38 (30.65%) Cucumber
3 30 (24.19%) Jenkins
4 22 (17.74%) Git
5 15 (12.10%) JIRA
6 12 (9.68%) JMeter
7 11 (8.87%) Appium
8 8 (6.45%) SpecFlow
9 7 (5.65%) JUnit
10 6 (4.84%) Jasmine
10 6 (4.84%) Mocha
10 6 (4.84%) REST Assured
10 6 (4.84%) Zephyr
11 5 (4.03%) Android Studio
11 5 (4.03%) Bitbucket
11 5 (4.03%) Bugzilla
11 5 (4.03%) Visual Studio
12 4 (3.23%) GitLab
12 4 (3.23%) Mockito
General
1 19 (15.32%) Social Skills
2 18 (14.52%) Finance
3 6 (4.84%) Tech for Good
4 5 (4.03%) Analytical Skills
4 5 (4.03%) Legal
5 4 (3.23%) Banking
5 4 (3.23%) Documentation Skills
5 4 (3.23%) Games
5 4 (3.23%) Health Technology
6 3 (2.42%) Influencing Skills
6 3 (2.42%) Public Sector
7 2 (1.61%) Automotive
7 2 (1.61%) Inclusion and Diversity
8 1 (0.81%) Law
8 1 (0.81%) Publishing
8 1 (0.81%) Telecoms
Job Titles
1 38 (30.65%) Developer
2 35 (28.23%) Senior
3 25 (20.16%) QA Engineer
4 24 (19.35%) Lead
5 18 (14.52%) Senior Developer
6 13 (10.48%) Software Engineer
7 9 (7.26%) QA Leader
8 8 (6.45%) Front-End Developer (Client-Side Developer)
8 8 (6.45%) Software Developer
9 7 (5.65%) JavaScript Developer
9 7 (5.65%) React Developer
9 7 (5.65%) Tester
10 6 (4.84%) Angular Developer
10 6 (4.84%) Backend Developer
10 6 (4.84%) Developer in Test
10 6 (4.84%) Senior Backend Developer
10 6 (4.84%) Senior Front-End Developer
10 6 (4.84%) Senior QA Engineer
11 5 (4.03%) Senior Web Developer
11 5 (4.03%) Web Developer
Libraries, Frameworks & Software Standards
1 36 (29.03%) React
2 30 (24.19%) AngularJS
3 28 (22.58%) Jest
4 26 (20.97%) Node.js
5 21 (16.94%) Playwright
6 16 (12.90%) REST
7 15 (12.10%) Vue
8 14 (11.29%) GraphQL
8 14 (11.29%) WebdriverIO
9 13 (10.48%) CSS
10 12 (9.68%) React Native
11 11 (8.87%) Redux
12 10 (8.06%) jQuery
12 10 (8.06%) NestJS
12 10 (8.06%) Sass
12 10 (8.06%) Web Services
13 9 (7.26%) Spring
13 9 (7.26%) Spring Boot
13 9 (7.26%) Tailwind CSS
14 8 (6.45%) Express.js
Miscellaneous
1 11 (8.87%) Product Ownership
2 9 (7.26%) Client/Server
3 7 (5.65%) Virtual Team
4 6 (4.84%) Greenfield Project
5 5 (4.03%) Enterprise Software
5 5 (4.03%) Mobile App
5 5 (4.03%) Replication
5 5 (4.03%) Social Network
6 3 (2.42%) Private Cloud
7 2 (1.61%) Driving Licence
7 2 (1.61%) Online Banking
7 2 (1.61%) Public Cloud
7 2 (1.61%) Social Media
8 1 (0.81%) Cyber Defence
8 1 (0.81%) Graphic Design
8 1 (0.81%) NHS
8 1 (0.81%) Onboarding
Operating Systems
1 11 (8.87%) Android
2 6 (4.84%) Apple iOS
3 5 (4.03%) Windows
Processes & Methodologies
1 51 (41.13%) Test Automation
2 42 (33.87%) Agile
3 39 (31.45%) API Testing
4 34 (27.42%) CI/CD
5 33 (26.61%) DevOps
6 30 (24.19%) BDD
7 29 (23.39%) SDET
7 29 (23.39%) Software Engineering
8 28 (22.58%) Microservices
8 28 (22.58%) Software Testing
9 18 (14.52%) Clean Code
9 18 (14.52%) Test Strategy
10 16 (12.90%) TDD
11 15 (12.10%) Problem-Solving
11 15 (12.10%) User Experience
12 14 (11.29%) Front End Development
12 14 (11.29%) QA Automation
13 13 (10.48%) Artificial Intelligence
13 13 (10.48%) Continuous Improvement
14 12 (9.68%) Unit Testing
Programming Languages
1 78 (62.90%) JavaScript
2 52 (41.94%) TypeScript
3 30 (24.19%) Java
4 14 (11.29%) Python
5 12 (9.68%) SQL
6 10 (8.06%) C#
7 7 (5.65%) Kotlin
8 5 (4.03%) PHP
8 5 (4.03%) Swift
9 2 (1.61%) C++
10 1 (0.81%) VB
10 1 (0.81%) VBScript
Qualifications
1 6 (4.84%) Degree
1 6 (4.84%) Security Cleared
2 5 (4.03%) SC Cleared
3 3 (2.42%) DV Cleared
4 2 (1.61%) OCP
4 2 (1.61%) Oracle Certification
5 1 (0.81%) Computer Science Degree
5 1 (0.81%) ISTQB
Quality Assurance & Compliance
1 61 (49.19%) QA
2 6 (4.84%) Cyber Essentials
2 6 (4.84%) ISO/IEC 27001
3 2 (1.61%) Accessibility
System Software
1 15 (12.10%) Docker
Systems Management
1 15 (12.10%) Kubernetes
2 7 (5.65%) Terraform
3 6 (4.84%) Grafana
3 6 (4.84%) Prometheus
4 5 (4.03%) HP Quality Center
5 2 (1.61%) Ansible
Vendors
1 5 (4.03%) HP
1 5 (4.03%) Microsoft
2 4 (3.23%) Adobe
2 4 (3.23%) Splunk