Atlassian Jobs with Hybrid/Remote/WFH Options

Atlassian
UK > Work from Home

The table below provides summary statistics for permanent remote or hybrid work requiring knowledge or experience of Atlassian products and/or services. It includes a benchmarking guide to the annual salaries offered in vacancies that cited Atlassian over the 6 months leading up to 4 May 2025, comparing them to the same period in the previous two years.

The figures below represent the IT labour market in general and are not representative of salaries within Atlassian Software Systems.

6 months to
4 May 2025
Same period 2024 Same period 2023
Rank 385 491 460
Rank change year-on-year +106 -31 +53
Permanent jobs citing Atlassian 30 92 220
As % of all permanent jobs with a WFH option 0.20% 0.27% 0.52%
As % of the Vendors category 0.43% 0.65% 1.28%
Number of salaries quoted 18 89 113
10th Percentile £49,063 £42,439 £47,750
25th Percentile £55,000 £47,250 £53,970
Median annual salary (50th Percentile) £60,000 £73,805 £57,810
Median % change year-on-year -18.70% +27.67% +0.54%
75th Percentile £74,505 £75,772 £72,647
90th Percentile £80,038 £77,500 £99,500
UK median annual salary £60,000 £65,000 £65,000
% change year-on-year -7.69% - +8.33%

All Vendors
Work from Home

Atlassian falls under the Vendor Products and Services category. For comparison with the information above, the following table provides summary statistics for all permanent job vacancies with a remote or hybrid options requiring knowledge or experience of all vendor products and services.

Permanent vacancies with a requirement for knowledge or experience of vendor products and services 7,000 14,077 17,157
As % of all permanent jobs with a WFH option 45.69% 41.60% 40.36%
Number of salaries quoted 4,507 10,066 11,423
10th Percentile £25,087 £31,250 £32,500
25th Percentile £37,170 £41,250 £43,523
Median annual salary (50th Percentile) £57,000 £55,000 £59,191
Median % change year-on-year +3.64% -7.08% +2.94%
75th Percentile £72,500 £71,250 £77,500
90th Percentile £93,761 £87,500 £92,500
UK median annual salary £55,000 £50,000 £57,500
% change year-on-year +10.00% -13.04% +4.55%

Atlassian
Trend for Jobs with a WFH Option

Job vacancies with remote working options citing Atlassian as a proportion of all IT jobs advertised.
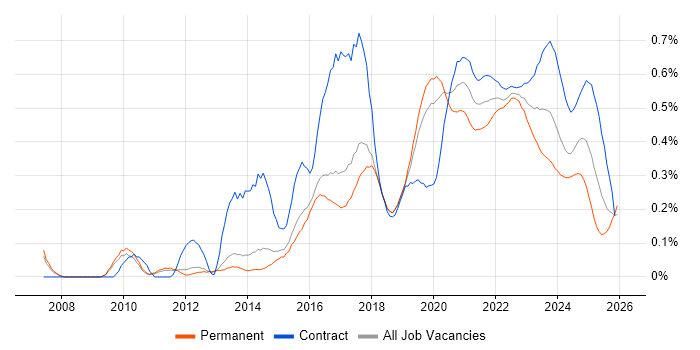
Atlassian trend for jobs with Hybrid/Remote/WFH options

Atlassian
Salary Trend for Jobs with a WFH Option

3-month moving average salary quoted in job vacancies with remote working options citing Atlassian.

Atlassian salary trend for jobs with a WFH option

Atlassian
Salary Histogram for Jobs with a WFH Option

Salary distribution for jobs with remote working options citing Atlassian over the 6 months to 4 May 2025.

Atlassian salary histogram for jobs with a WFH option

Atlassian
Co-occurring Skills and Capabilities with WFH Options by Category

The follow tables expand on the table above by listing co-occurrences grouped by category. The same employment type, locality and period is covered with up to 20 co-occurrences shown in each of the following categories:

Application Platforms
1 18 (60.00%) Confluence
2 2 (6.67%) SharePoint
Applications
1 2 (6.67%) Microsoft Office
Cloud Services
1 15 (50.00%) AWS
2 5 (16.67%) Azure
3 4 (13.33%) Amazon EKS
3 4 (13.33%) Amazon S3
3 4 (13.33%) GitHub
4 3 (10.00%) Amazon EC2
4 3 (10.00%) AWS Lambda
4 3 (10.00%) GCP
4 3 (10.00%) Google Kubernetes Engine
4 3 (10.00%) Microsoft 365
4 3 (10.00%) Serverless
5 2 (6.67%) AWS CloudFormation
5 2 (6.67%) Dropbox
5 2 (6.67%) Entra ID
5 2 (6.67%) Miro
5 2 (6.67%) OneDrive
6 1 (3.33%) Amazon ECR
6 1 (3.33%) Azure Synapse Analytics
6 1 (3.33%) Sentry
6 1 (3.33%) Virtual Private Cloud
Communications & Networking
1 1 (3.33%) DHCP
1 1 (3.33%) DNS
1 1 (3.33%) Firewall
1 1 (3.33%) Internet
1 1 (3.33%) TCP/IP
Database & Business Intelligence
1 5 (16.67%) PostgreSQL
2 4 (13.33%) MongoDB
3 3 (10.00%) Relational Database
4 2 (6.67%) Amazon RDS
4 2 (6.67%) MySQL
4 2 (6.67%) SQL Server
5 1 (3.33%) Amazon Aurora
5 1 (3.33%) Azure SQL Database
5 1 (3.33%) Elasticsearch
5 1 (3.33%) InfluxDB
5 1 (3.33%) NoSQL
5 1 (3.33%) Pentaho
5 1 (3.33%) Power BI
5 1 (3.33%) Redis
5 1 (3.33%) Tableau
Development Applications
1 26 (86.67%) JIRA
2 13 (43.33%) Jenkins
2 13 (43.33%) SonarQube
3 7 (23.33%) Atlassian Bamboo
3 7 (23.33%) Git
4 6 (20.00%) AppScan
5 4 (13.33%) Artifactory
6 3 (10.00%) Cucumber
6 3 (10.00%) IBM UrbanCode
6 3 (10.00%) Selenium
6 3 (10.00%) Sonatype Nexus
7 2 (6.67%) Bitbucket
8 1 (3.33%) LabVIEW
8 1 (3.33%) Rational DOORS
8 1 (3.33%) TestRail
General
1 13 (43.33%) Finance
2 7 (23.33%) Social Skills
3 3 (10.00%) Banking
4 2 (6.67%) Documentation Skills
5 1 (3.33%) Health Technology
5 1 (3.33%) Inclusion and Diversity
5 1 (3.33%) Manufacturing
5 1 (3.33%) Military
5 1 (3.33%) Public Sector
Job Titles
1 11 (36.67%) DevOps Engineer
2 4 (13.33%) Administrator
2 4 (13.33%) AWS Engineer
2 4 (13.33%) JIRA Administrator
2 4 (13.33%) Senior
2 4 (13.33%) Senior DevOps
2 4 (13.33%) Senior DevOps Engineer
3 3 (10.00%) Analyst
3 3 (10.00%) AWS DevOps
3 3 (10.00%) AWS DevOps Engineer
3 3 (10.00%) Environment And Release Manager
3 3 (10.00%) Environment Manager
3 3 (10.00%) JIRA Engineer
3 3 (10.00%) Release Manager
4 2 (6.67%) Development Analyst
4 2 (6.67%) JIRA Expert
4 2 (6.67%) Software Analyst
4 2 (6.67%) Software Development Analyst
4 2 (6.67%) Software Development Business Analyst
4 2 (6.67%) Technical Business Analyst
Libraries, Frameworks & Software Standards
1 5 (16.67%) Elastic Stack
2 4 (13.33%) JSON
2 4 (13.33%) REST
3 3 (10.00%) Django
3 3 (10.00%) FastAPI
3 3 (10.00%) Flask
3 3 (10.00%) Playwright
3 3 (10.00%) RabbitMQ
4 2 (6.67%) GraphQL
4 2 (6.67%) HTML
4 2 (6.67%) Kafka
4 2 (6.67%) LDAP
4 2 (6.67%) Node.js
4 2 (6.67%) OAuth
4 2 (6.67%) React
5 1 (3.33%) AWS CDK
5 1 (3.33%) Microsoft Graph
Miscellaneous
1 7 (23.33%) Management Information System
2 6 (20.00%) CMDB
2 6 (20.00%) Hybrid Cloud
3 4 (13.33%) Distributed Systems
4 3 (10.00%) Foreign Exchange (FX)
4 3 (10.00%) Mainframe
4 3 (10.00%) Product Ownership
5 2 (6.67%) Onboarding
6 1 (3.33%) Enterprise Software
6 1 (3.33%) IoT
6 1 (3.33%) Legacy Systems
6 1 (3.33%) NHS
Operating Systems
1 5 (16.67%) Linux
2 4 (13.33%) Windows
3 2 (6.67%) Windows 10
4 1 (3.33%) Android
4 1 (3.33%) Apple iOS
4 1 (3.33%) Debian
4 1 (3.33%) Unix
4 1 (3.33%) Windows Server
Processes & Methodologies
1 15 (50.00%) DevOps
2 11 (36.67%) Agile
3 8 (26.67%) Microservices
4 7 (23.33%) Customer Service
4 7 (23.33%) Cybersecurity
5 6 (20.00%) Application Security
5 6 (20.00%) Design Patterns
5 6 (20.00%) Dynamic Application Security Testing
5 6 (20.00%) RAD
5 6 (20.00%) Scrum
5 6 (20.00%) Service Management
5 6 (20.00%) Static Application Security Testing
5 6 (20.00%) Test Automation
6 5 (16.67%) CI/CD
6 5 (16.67%) Deployment Automation
6 5 (16.67%) Software Engineering
7 4 (13.33%) Infrastructure as Code
8 3 (10.00%) Auto-Scaling
8 3 (10.00%) End-to-End Testing
8 3 (10.00%) Security Hardening
Programming Languages
1 13 (43.33%) Python
2 7 (23.33%) Java
3 6 (20.00%) Groovy
4 4 (13.33%) SQL
5 3 (10.00%) Perl
5 3 (10.00%) PowerShell
5 3 (10.00%) Shell Script
6 2 (6.67%) Bash
6 2 (6.67%) Go
6 2 (6.67%) JavaScript
7 1 (3.33%) Fortran
7 1 (3.33%) MATLAB
7 1 (3.33%) TypeScript
Qualifications
1 5 (16.67%) Security Cleared
2 3 (10.00%) OCP
2 3 (10.00%) Oracle Certification
3 2 (6.67%) Degree
3 2 (6.67%) SC Cleared
4 1 (3.33%) Master's Degree
Quality Assurance & Compliance
1 12 (40.00%) SLA
2 6 (20.00%) QA
3 2 (6.67%) ISO/IEC 27001
4 1 (3.33%) Accessibility
4 1 (3.33%) Cyber Essentials
4 1 (3.33%) Data Quality
4 1 (3.33%) GDPR
4 1 (3.33%) ISO 13485
4 1 (3.33%) ISO 9001
4 1 (3.33%) NIST
4 1 (3.33%) PCI DSS
System Software
1 5 (16.67%) Docker
2 2 (6.67%) Active Directory
3 1 (3.33%) Hyper-V
3 1 (3.33%) VMware Infrastructure
Systems Management
1 11 (36.67%) Kubernetes
2 10 (33.33%) Ansible
3 9 (30.00%) Progress Chef
4 8 (26.67%) Terraform
5 7 (23.33%) Opsgenie
6 6 (20.00%) Puppet
7 4 (13.33%) Argo
7 4 (13.33%) Prometheus
8 3 (10.00%) Grafana
8 3 (10.00%) Istio
8 3 (10.00%) Packer
9 2 (6.67%) Single Sign-On
10 1 (3.33%) Check_MK
10 1 (3.33%) FortiGate
10 1 (3.33%) Kibana
10 1 (3.33%) Kustomize
10 1 (3.33%) logstash
Vendors
1 6 (20.00%) IBM
2 4 (13.33%) AppDynamics
2 4 (13.33%) Microsoft
3 3 (10.00%) Dynatrace
4 1 (3.33%) Imperva
4 1 (3.33%) New Relic
4 1 (3.33%) Okta
4 1 (3.33%) OneLogin
4 1 (3.33%) Red Hat
4 1 (3.33%) VMware
4 1 (3.33%) YouTube