Palo Alto Jobs with Work from Home Options

Palo Alto
UK > Work from Home

The table below provides summary statistics for permanent remote or hybrid work requiring knowledge or experience of Palo Alto products and/or services. It includes a benchmarking guide to the annual salaries offered in vacancies that cited Palo Alto over the 6 months leading up to 16 June 2024, comparing them to the same period in the previous two years.

The figures below represent the IT labour market in general and are not representative of salaries within Palo Alto Networks.

6 months to
16 Jun 2024
Same period 2023 Same period 2022
Rank 370 437 580
Rank change year-on-year +67 +143 -152
Permanent jobs citing Palo Alto 243 201 334
As % of all permanent jobs with a WFH option 0.68% 0.54% 0.44%
As % of the Vendors category 1.72% 1.34% 1.18%
Number of salaries quoted 154 159 276
10th Percentile £31,250 £42,400 £42,250
25th Percentile £41,250 £47,500 £47,500
Median annual salary (50th Percentile) £53,750 £60,000 £67,500
Median % change year-on-year -10.42% -11.11% +8.00%
75th Percentile £63,750 £73,750 £78,750
90th Percentile £77,500 £81,750 £103,125
UK median annual salary £56,250 £60,000 £60,000
% change year-on-year -6.25% - -

All Vendors
Work from Home

Palo Alto falls under the Vendor Products and Services category. For comparison with the information above, the following table provides summary statistics for all permanent job vacancies with a remote or hybrid options requiring knowledge or experience of all vendor products and services.

Permanent vacancies with a requirement for knowledge or experience of vendor products and services 14,105 15,048 28,246
As % of all permanent jobs with a WFH option 39.68% 40.15% 37.33%
Number of salaries quoted 9,890 10,560 15,532
10th Percentile £31,250 £33,000 £32,500
25th Percentile £41,250 £43,750 £42,500
Median annual salary (50th Percentile) £55,000 £60,000 £57,500
Median % change year-on-year -8.33% +4.35% +4.55%
75th Percentile £71,250 £77,500 £77,500
90th Percentile £87,500 £92,500 £92,500
UK median annual salary £50,000 £57,500 £55,000
% change year-on-year -13.04% +4.55% +4.76%

Palo Alto
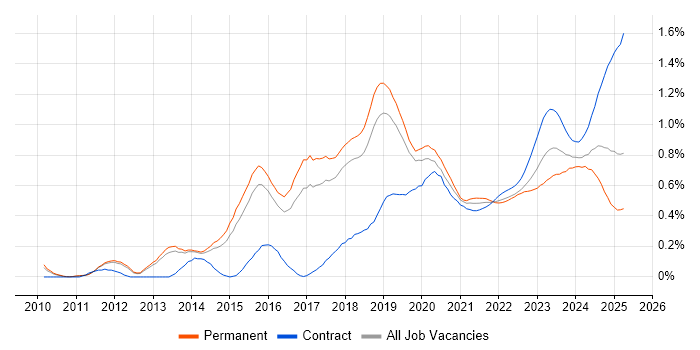
Trend for Jobs with a WFH Option

Job vacancies with a work from home option citing Palo Alto as a proportion of all IT jobs advertised.

Palo Alto trend for jobs with a WFH option

Palo Alto
Salary Trend for Jobs with a WFH Option

3-month moving average salary quoted in job vacancies with a work from home option citing Palo Alto.

Palo Alto salary trend for jobs with a WFH option

Palo Alto
Salary Histogram for Jobs with a WFH Option

Salary distribution for jobs with a work from home option citing Palo Alto over the 6 months to 16 June 2024.

Palo Alto salary histogram for jobs with a WFH option

Palo Alto
Co-occurring Skills and Capabilities with WFH Options by Category

The follow tables expand on the table above by listing co-occurrences grouped by category. The same employment type, locality and period is covered with up to 20 co-occurrences shown in each of the following categories:

Application Platforms
1 54 (22.22%) Apache
2 5 (2.06%) SharePoint
3 2 (0.82%) Microsoft Exchange
4 1 (0.41%) Confluence
4 1 (0.41%) IIS
4 1 (0.41%) nginx
Applications
1 4 (1.65%) Microsoft Excel
1 4 (1.65%) Microsoft Office
2 3 (1.23%) MS Visio
2 3 (1.23%) Spreadsheet
Business Applications
1 1 (0.41%) Dynamics GP
Cloud Services
1 55 (22.63%) Amazon S3
2 47 (19.34%) Azure
3 30 (12.35%) AWS
4 26 (10.70%) Microsoft 365
5 10 (4.12%) SaaS
6 8 (3.29%) IaaS
6 8 (3.29%) PaaS
7 5 (2.06%) Datadog
7 5 (2.06%) Rubrik
8 4 (1.65%) OneDrive
9 3 (1.23%) Amazon ECS
9 3 (1.23%) Cloud Computing
10 2 (0.82%) Azure ExpressRoute
10 2 (0.82%) Azure Sentinel
10 2 (0.82%) Dynamics 365
10 2 (0.82%) Entra ID
10 2 (0.82%) GitHub
10 2 (0.82%) Mimecast
10 2 (0.82%) WhatsApp
11 1 (0.41%) Amazon CloudWatch
Communications & Networking
1 170 (69.96%) Firewall
2 104 (42.80%) VPN
3 67 (27.57%) IPsec
4 66 (27.16%) LAN
5 63 (25.93%) Internet
6 61 (25.10%) WAN
7 60 (24.69%) Network Security
8 58 (23.87%) SNMP
9 53 (21.81%) Wireless
10 28 (11.52%) Wi-Fi
11 27 (11.11%) DNS
12 22 (9.05%) MPLS
12 22 (9.05%) OSPF
13 20 (8.23%) SD-WAN
14 18 (7.41%) BGP
15 16 (6.58%) DHCP
16 14 (5.76%) Unified Communications
16 14 (5.76%) WLAN
17 13 (5.35%) Cisco Firepower
17 13 (5.35%) Cisco ISE
Database & Business Intelligence
1 54 (22.22%) Elasticsearch
1 54 (22.22%) MongoDB
2 4 (1.65%) SQL Server
3 1 (0.41%) MySQL
3 1 (0.41%) Power BI
Development Applications
1 2 (0.82%) GitLab
2 1 (0.41%) Git
2 1 (0.41%) JIRA
2 1 (0.41%) TeamCity
General
1 76 (31.28%) Finance
2 39 (16.05%) Social Skills
3 22 (9.05%) Inclusion and Diversity
4 12 (4.94%) Aerospace
4 12 (4.94%) Analytical Skills
5 10 (4.12%) Public Sector
6 6 (2.47%) Documentation Skills
7 5 (2.06%) Telecoms
8 4 (1.65%) Law
8 4 (1.65%) Marketing
9 3 (1.23%) Advertising
10 2 (0.82%) Banking
10 2 (0.82%) Billing
10 2 (0.82%) Online Betting
10 2 (0.82%) Retail Banking
11 1 (0.41%) Legal
Job Titles
1 75 (30.86%) Network Engineer
2 67 (27.57%) Consultant
3 54 (22.22%) NetApp Consultant
4 48 (19.75%) Senior
5 25 (10.29%) Network Specialist
6 24 (9.88%) IT Engineer
6 24 (9.88%) Senior Network Engineer
7 20 (8.23%) Project Engineer
8 16 (6.58%) Infrastructure Engineer
9 15 (6.17%) IT Support
9 15 (6.17%) Junior
10 14 (5.76%) IP Engineer
10 14 (5.76%) Juniper Engineer
10 14 (5.76%) Operations Engineer
10 14 (5.76%) Senior IP Engineer
10 14 (5.76%) Senior Operations Engineer
10 14 (5.76%) Support Engineer
11 13 (5.35%) IT Support Engineer
11 13 (5.35%) Junior IT Engineer
11 13 (5.35%) Junior IT Support
Libraries, Frameworks & Software Standards
1 54 (22.22%) RabbitMQ
1 54 (22.22%) YAML
Miscellaneous
1 91 (37.45%) Data Centre
2 13 (5.35%) Driving Licence
3 3 (1.23%) Cyber Threat
3 3 (1.23%) Self-Motivation
4 2 (0.82%) Client/Server
4 2 (0.82%) Enterprise Software
4 2 (0.82%) Management Information System
4 2 (0.82%) Public Cloud
4 2 (0.82%) Video Conferencing
5 1 (0.41%) Distributed Denial-of-Service
5 1 (0.41%) Enterprise Storage
5 1 (0.41%) Security Posture
Operating Systems
1 70 (28.81%) Windows
2 65 (26.75%) Linux
3 54 (22.22%) Data ONTAP
4 9 (3.70%) Windows Server
5 3 (1.23%) Windows Server 2019
6 2 (0.82%) Windows 10
6 2 (0.82%) Windows Server 2012
7 1 (0.41%) Windows 7
7 1 (0.41%) Windows Server 2003
7 1 (0.41%) Windows Server 2016
Processes & Methodologies
1 76 (31.28%) Problem-Solving
2 73 (30.04%) Project Management
3 55 (22.63%) Infrastructure Management
3 55 (22.63%) Project Planning
4 54 (22.22%) Actionable Insight
4 54 (22.22%) Release Management
4 54 (22.22%) Storage Management
5 30 (12.35%) Infrastructure Engineering
6 20 (8.23%) Network Architecture
7 17 (7.00%) Cloud Security
7 17 (7.00%) Information Security
8 15 (6.17%) Migration
9 14 (5.76%) Load Balancing
10 12 (4.94%) Cryptography
10 12 (4.94%) Information Management
10 12 (4.94%) Network Management
11 11 (4.53%) Mentoring
11 11 (4.53%) Network Monitoring
11 11 (4.53%) Roadmaps
12 10 (4.12%) Patch Management
Programming Languages
1 54 (22.22%) Python
2 6 (2.47%) PowerShell
3 1 (0.41%) Bash
3 1 (0.41%) SQL
Qualifications
1 71 (29.22%) Cisco Certification
2 46 (18.93%) CCNP
3 35 (14.40%) CCNA
4 30 (12.35%) Security Cleared
5 23 (9.47%) CCIE
6 17 (7.00%) JNCIP
7 15 (6.17%) CISSP
8 14 (5.76%) JNCIA
8 14 (5.76%) Network+ Certification
8 14 (5.76%) SC Cleared
9 13 (5.35%) Degree
10 12 (4.94%) DV Cleared
11 5 (2.06%) (ISC)2 CCSP
12 4 (1.65%) CCIE Security
12 4 (1.65%) CCSP
13 3 (1.23%) Azure Certification
13 3 (1.23%) CCDA
14 2 (0.82%) JNCIS
15 1 (0.41%) CCSA
15 1 (0.41%) CCSE
Quality Assurance & Compliance
1 7 (2.88%) ISO/IEC 27001
2 5 (2.06%) Cyber Essentials
2 5 (2.06%) Cyber Essentials PLUS
3 4 (1.65%) NIST
3 4 (1.65%) PCI DSS
3 4 (1.65%) SLA
4 2 (0.82%) QA
5 1 (0.41%) Accessibility
5 1 (0.41%) GDPR
System Software
1 60 (24.69%) VMware Infrastructure
2 57 (23.46%) Docker
3 13 (5.35%) Active Directory
4 4 (1.65%) vSphere
5 3 (1.23%) VMware NSX
6 2 (0.82%) Hyper-V
7 1 (0.41%) Firmware
7 1 (0.41%) Virtual Machines
7 1 (0.41%) VMware ESXi
Systems Management
1 64 (26.34%) Ansible
2 54 (22.22%) Kubernetes
2 54 (22.22%) Prometheus
2 54 (22.22%) vCenter Server
3 13 (5.35%) Cisco CUCM
3 13 (5.35%) ServiceCenter
4 12 (4.94%) FortiGate
5 4 (1.65%) EMC NetWorker
5 4 (1.65%) Microsoft Intune
6 3 (1.23%) Terraform
7 2 (0.82%) Norton AntiVirus
7 2 (0.82%) SCCM
7 2 (0.82%) SolarWinds Orion
8 1 (0.41%) CASB
8 1 (0.41%) Grafana
8 1 (0.41%) HAProxy
8 1 (0.41%) NetCrunch
8 1 (0.41%) Progress Chef
8 1 (0.41%) Puppet
8 1 (0.41%) SCVMM
Vendors
1 166 (68.31%) Cisco
2 85 (34.98%) VMware
3 61 (25.10%) Juniper
4 59 (24.28%) NetApp
5 56 (23.05%) Fortinet
6 54 (22.22%) Red Hat
6 54 (22.22%) SolidFire
7 53 (21.81%) Meraki
8 47 (19.34%) Aruba
9 43 (17.70%) Microsoft
10 39 (16.05%) CheckPoint
11 26 (10.70%) HP
12 18 (7.41%) Infoblox
13 16 (6.58%) Blue Coat
14 12 (4.94%) Riverbed
14 12 (4.94%) SolarWinds
15 10 (4.12%) F5
16 7 (2.88%) LogicMonitor
17 6 (2.47%) Extreme Networks
17 6 (2.47%) Veeam